

Health check timeouts, and resource tags that reach existing resources
Set a timeout on health checks
Health checks inops.json now take a timeout - how long, in seconds,
a single check can run before it counts as a failure. Leave it out and it defaults to 10 seconds.celery inspect ping, a
script that opens a database connection, an endpoint that does real work - could miss that window, count as a failure
and get the container restarted for no reason. The new 10 second default covers most of these. Raise timeout for
anything slower.It works the same for shell, HTTP, TCP and gRPC checks, and in the Helm chart you export from LocalOps.Every service with a health check picks up the new default on its next deploy, which rolls its containers once.
Nothing restarts until you deploy.
Fixed: account resource tags on existing environments
Account level resource tags - the key value pairs you add under Account settings > Resource tags - were only applied to environments created after you added them. Tags you added, changed or removed later never reached the cloud resources of environments that already existed.They do now. Refresh an existing environment and its resources pick up your current set of tags - added tags are attached, changed values are updated and removed tags are taken off. On AWS they land as tags, on GCP as labels.Look for the Refresh environment button in the top right corner of the environment dashboard.Cloud resources your services declare inops.json - S3 buckets, RDS instances, SQS queues and the like - pick up the
new tags on each service’s next deploy.See AWS resource tags for using tags to find your resources and analyze costs.Questions? Email us at support@localops.co or ping us in your Slack Connect support channel.SQL Server on RDS, and Grafana share links that work
SQL Server in ops.json
RDS instances declared in ops.json now take SQL Server alongside Postgres and MySQL.
Set engine to the edition you need - sqlserver-ex (Express), sqlserver-web (Web), sqlserver-se (Standard) or
sqlserver-ee (Enterprise). RDS provisions it license included, so there is no license of your own to bring.$dsn comes out as
sqlserver://$username:$password@$address:1433.A few things differ from Postgres and MySQL:- No database is created. RDS creates none on a SQL Server instance, so
$dbNameis not available and$dsnhas no database name. Create the databases your service needs yourself, for example from an init job. - At least 20 GB of storage, which is also the default.
- Standard and Enterprise need an
instance_type. Express and Web default todb.t3.small. - Multi-AZ is available on Standard and Enterprise only.
- Encryption at rest is on for every edition except Express, which RDS does not support it for.
1433 only from the
VPC’s own CIDR range, so your services reach it over the private network and nothing outside the environment can. The
credentials go to your service as environment variables. No connection string to paste into a config file, no inbound
rule to open.That covers your own access too - the CLI commands below reach the database from inside the cluster, so you never have
to make it public to query it.See Private only access for the networking details.See SQL Server for the full table of editions.ops connect and ops proxy speak SQL Server
As promised last week, --dep now reaches SQL Server instances too. Open a prompt
inside your environment:sqlcmd, since Microsoft publishes no sqlcmd image
that runs on ARM nodes. Its prompt works like psql - end each statement with ; instead of GO, and type \q to
quit. Exit the shell and the pod is deleted.Or relay the instance to a port on your machine:127.0.0.1,1433 with those credentials - SQL Server Management Studio
(SSMS), DataGrip, DBeaver, TablePlus or the VS Code MSSQL extension. Browse tables, run queries and inspect query plans
on the private RDS instance as if it were running locally.Trust the server certificate through the tunnel - -C for sqlcmd, or Trust server certificate in a GUI client.
The certificate is issued for the database’s real hostname, not your machine.See Connect to your databases or cache for the details.Fixed: Grafana share links
Every environment ships with its own Grafana, wired to the environment’s logs, metrics and cloud provider monitoring out of the box. Query logs across services, slice metrics by pod or node, build your own dashboards and panels, and set alerts on any of it.And whatever you find, you can share. Share → Link on a dashboard, a panel or an Explore query - down to the exact log lines you filtered to - gives you a unique short URL that opens the same view, with the same time range and filters, for whoever you send it to. Paste it into an incident channel or a ticket instead of a screenshot.Until now these links carried the wrong host and didn’t open. They now point at your environment’s Grafana domain:Full size editors for ops.json and Helm values
Theops.json and Helm values boxes on the service form showed a handful of lines at a time. Fine for a short config,
cramped for anything real.Both now carry an Edit button that opens a full size editor beside the form:- Line numbers in the gutter, so a line an error message points at is easy to land on.
- Syntax highlighting for JSON and YAML.
- Indentation markers - a vertical guide down each nesting level, so you can tell at a glance which block a key sits under.
- Room to work - the editor runs the full height of the window instead of the few lines the inline box showed.
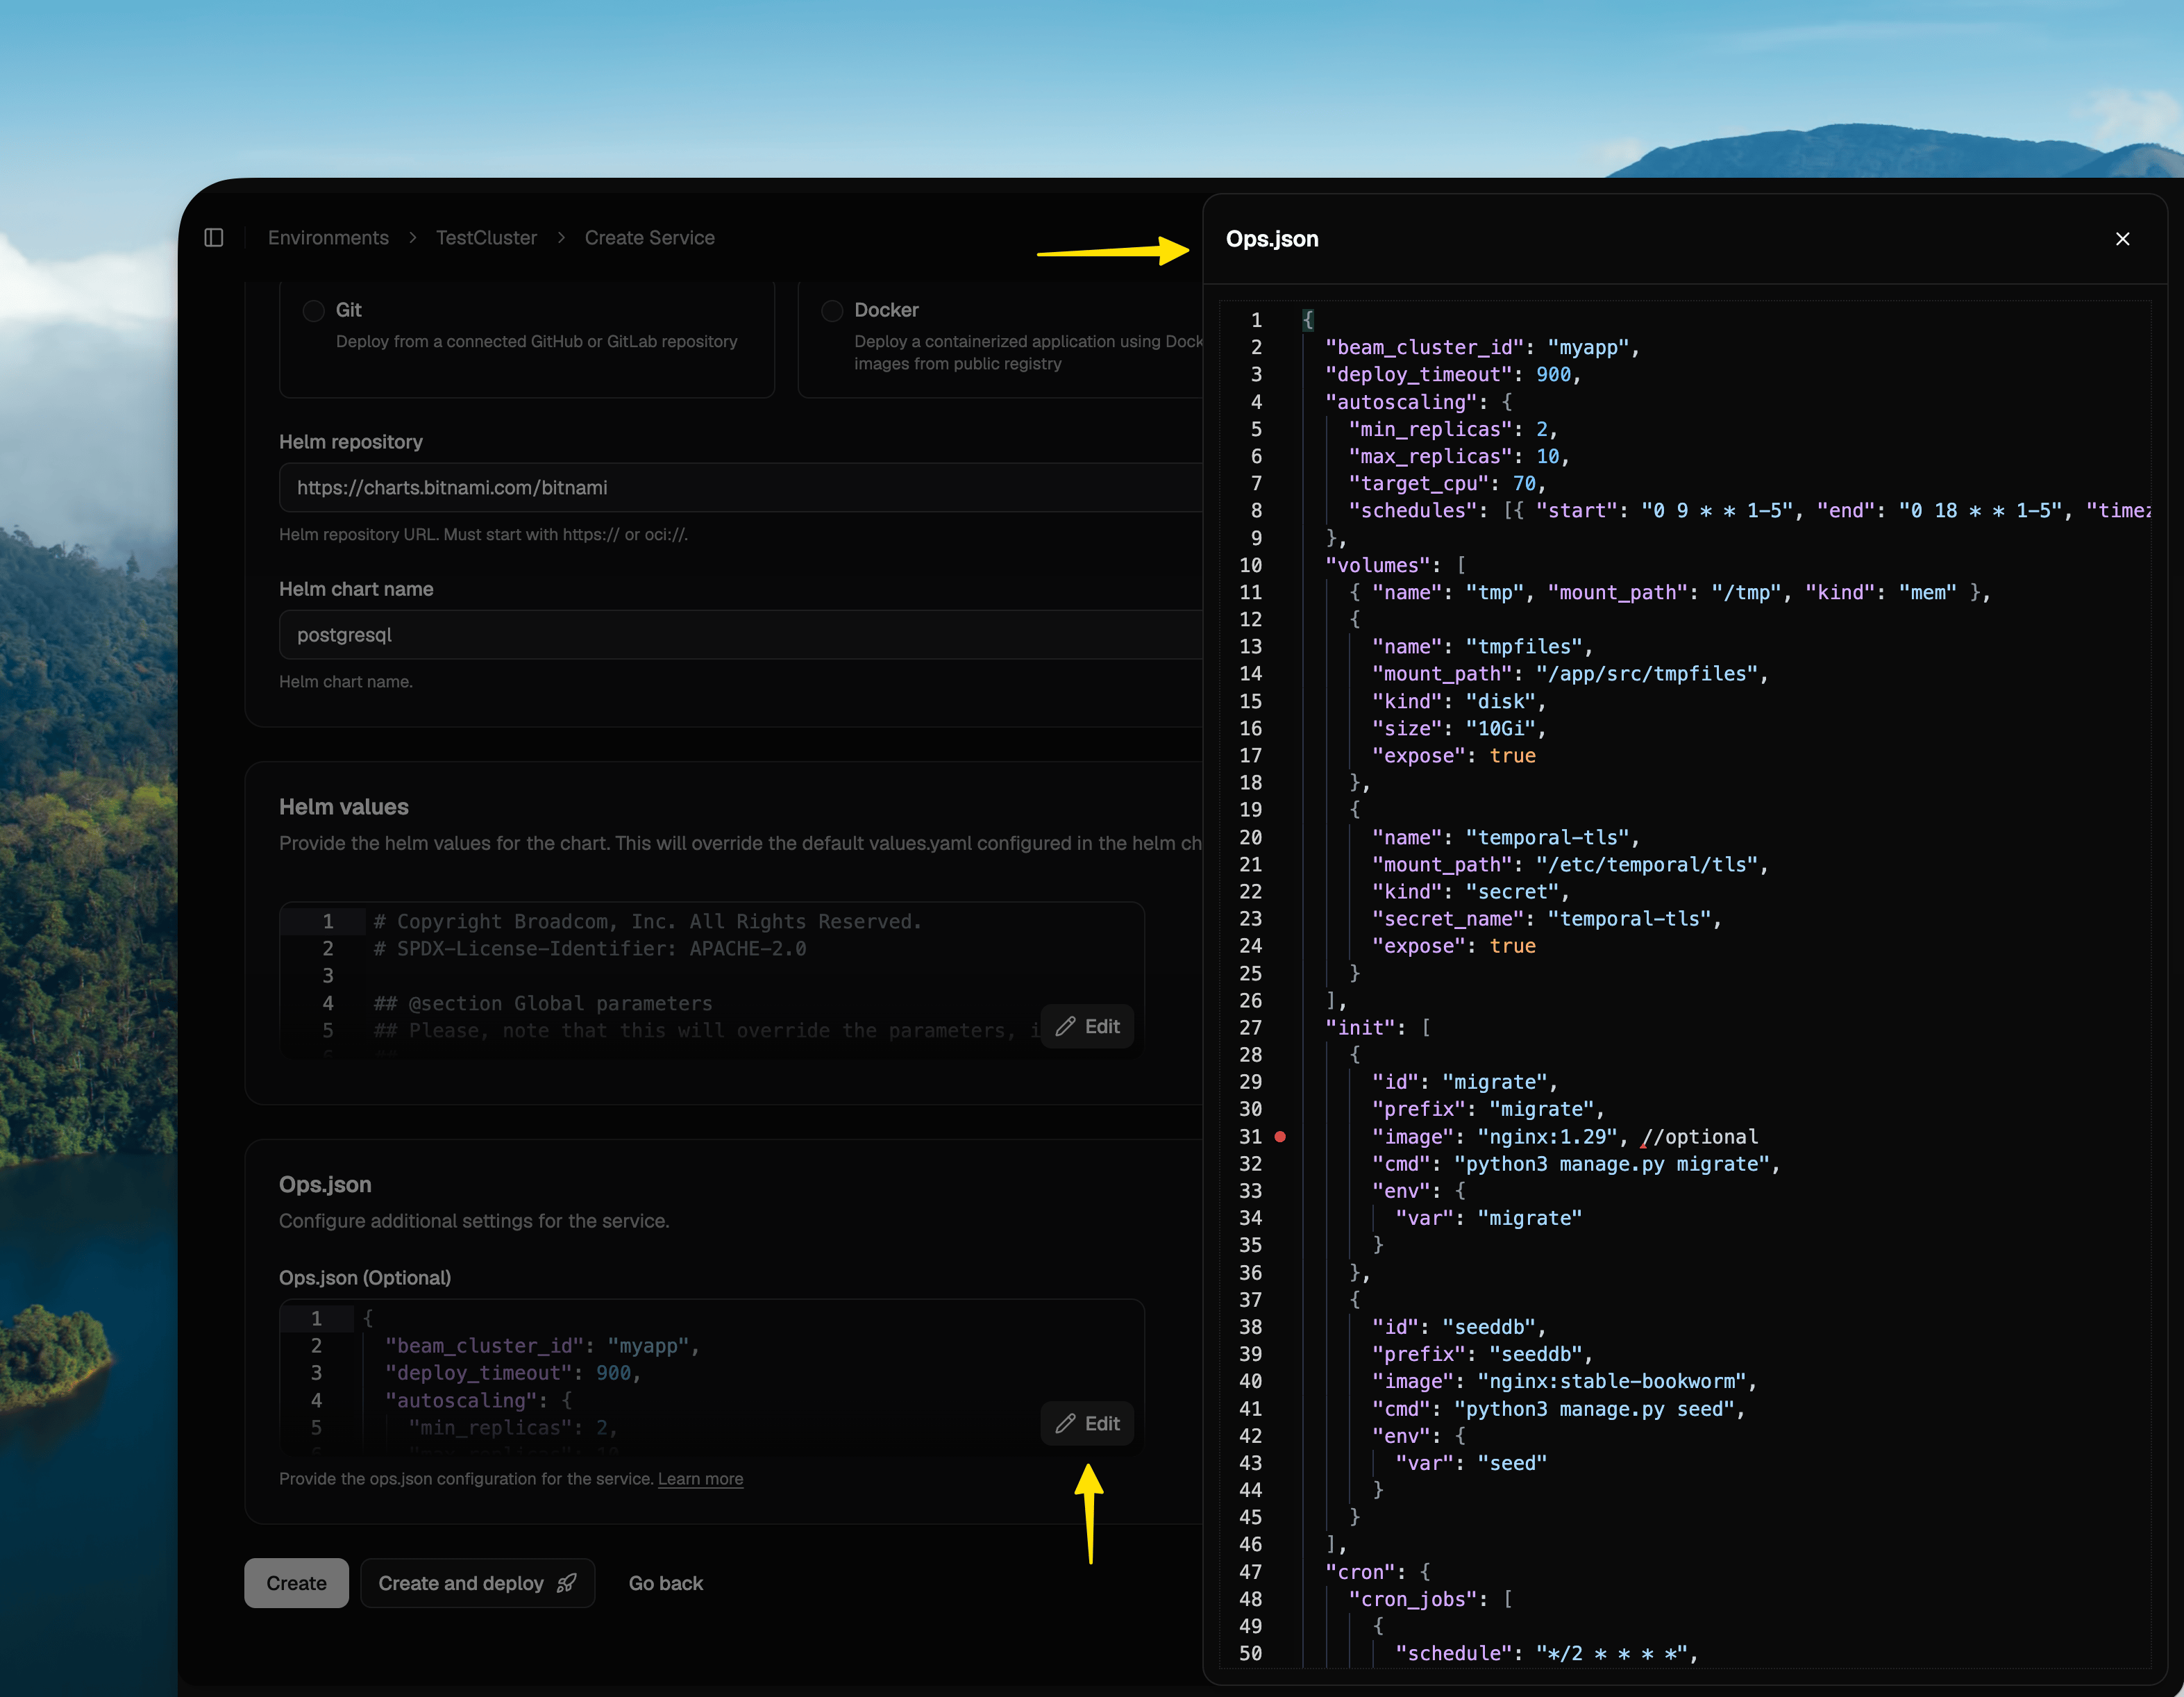
ops.json is one file, committed next to your code, that declares everything LocalOps
sets up around a service on each deploy - init jobs, health checks, cloud resources, volumes, crons, autoscaling and
ingress. Push a change and the environment reshapes itself to match.Which is why it grows, and why scrolling it a handful of lines at a time stops being workable.Helm values have grown for a second reason. Since
secrets became available for Helm chart services in August, a values.yaml carries
existingSecret and secretKeys references on top of everything the chart already ships. The full size editor gives
you enough of the file on screen to find what you are editing.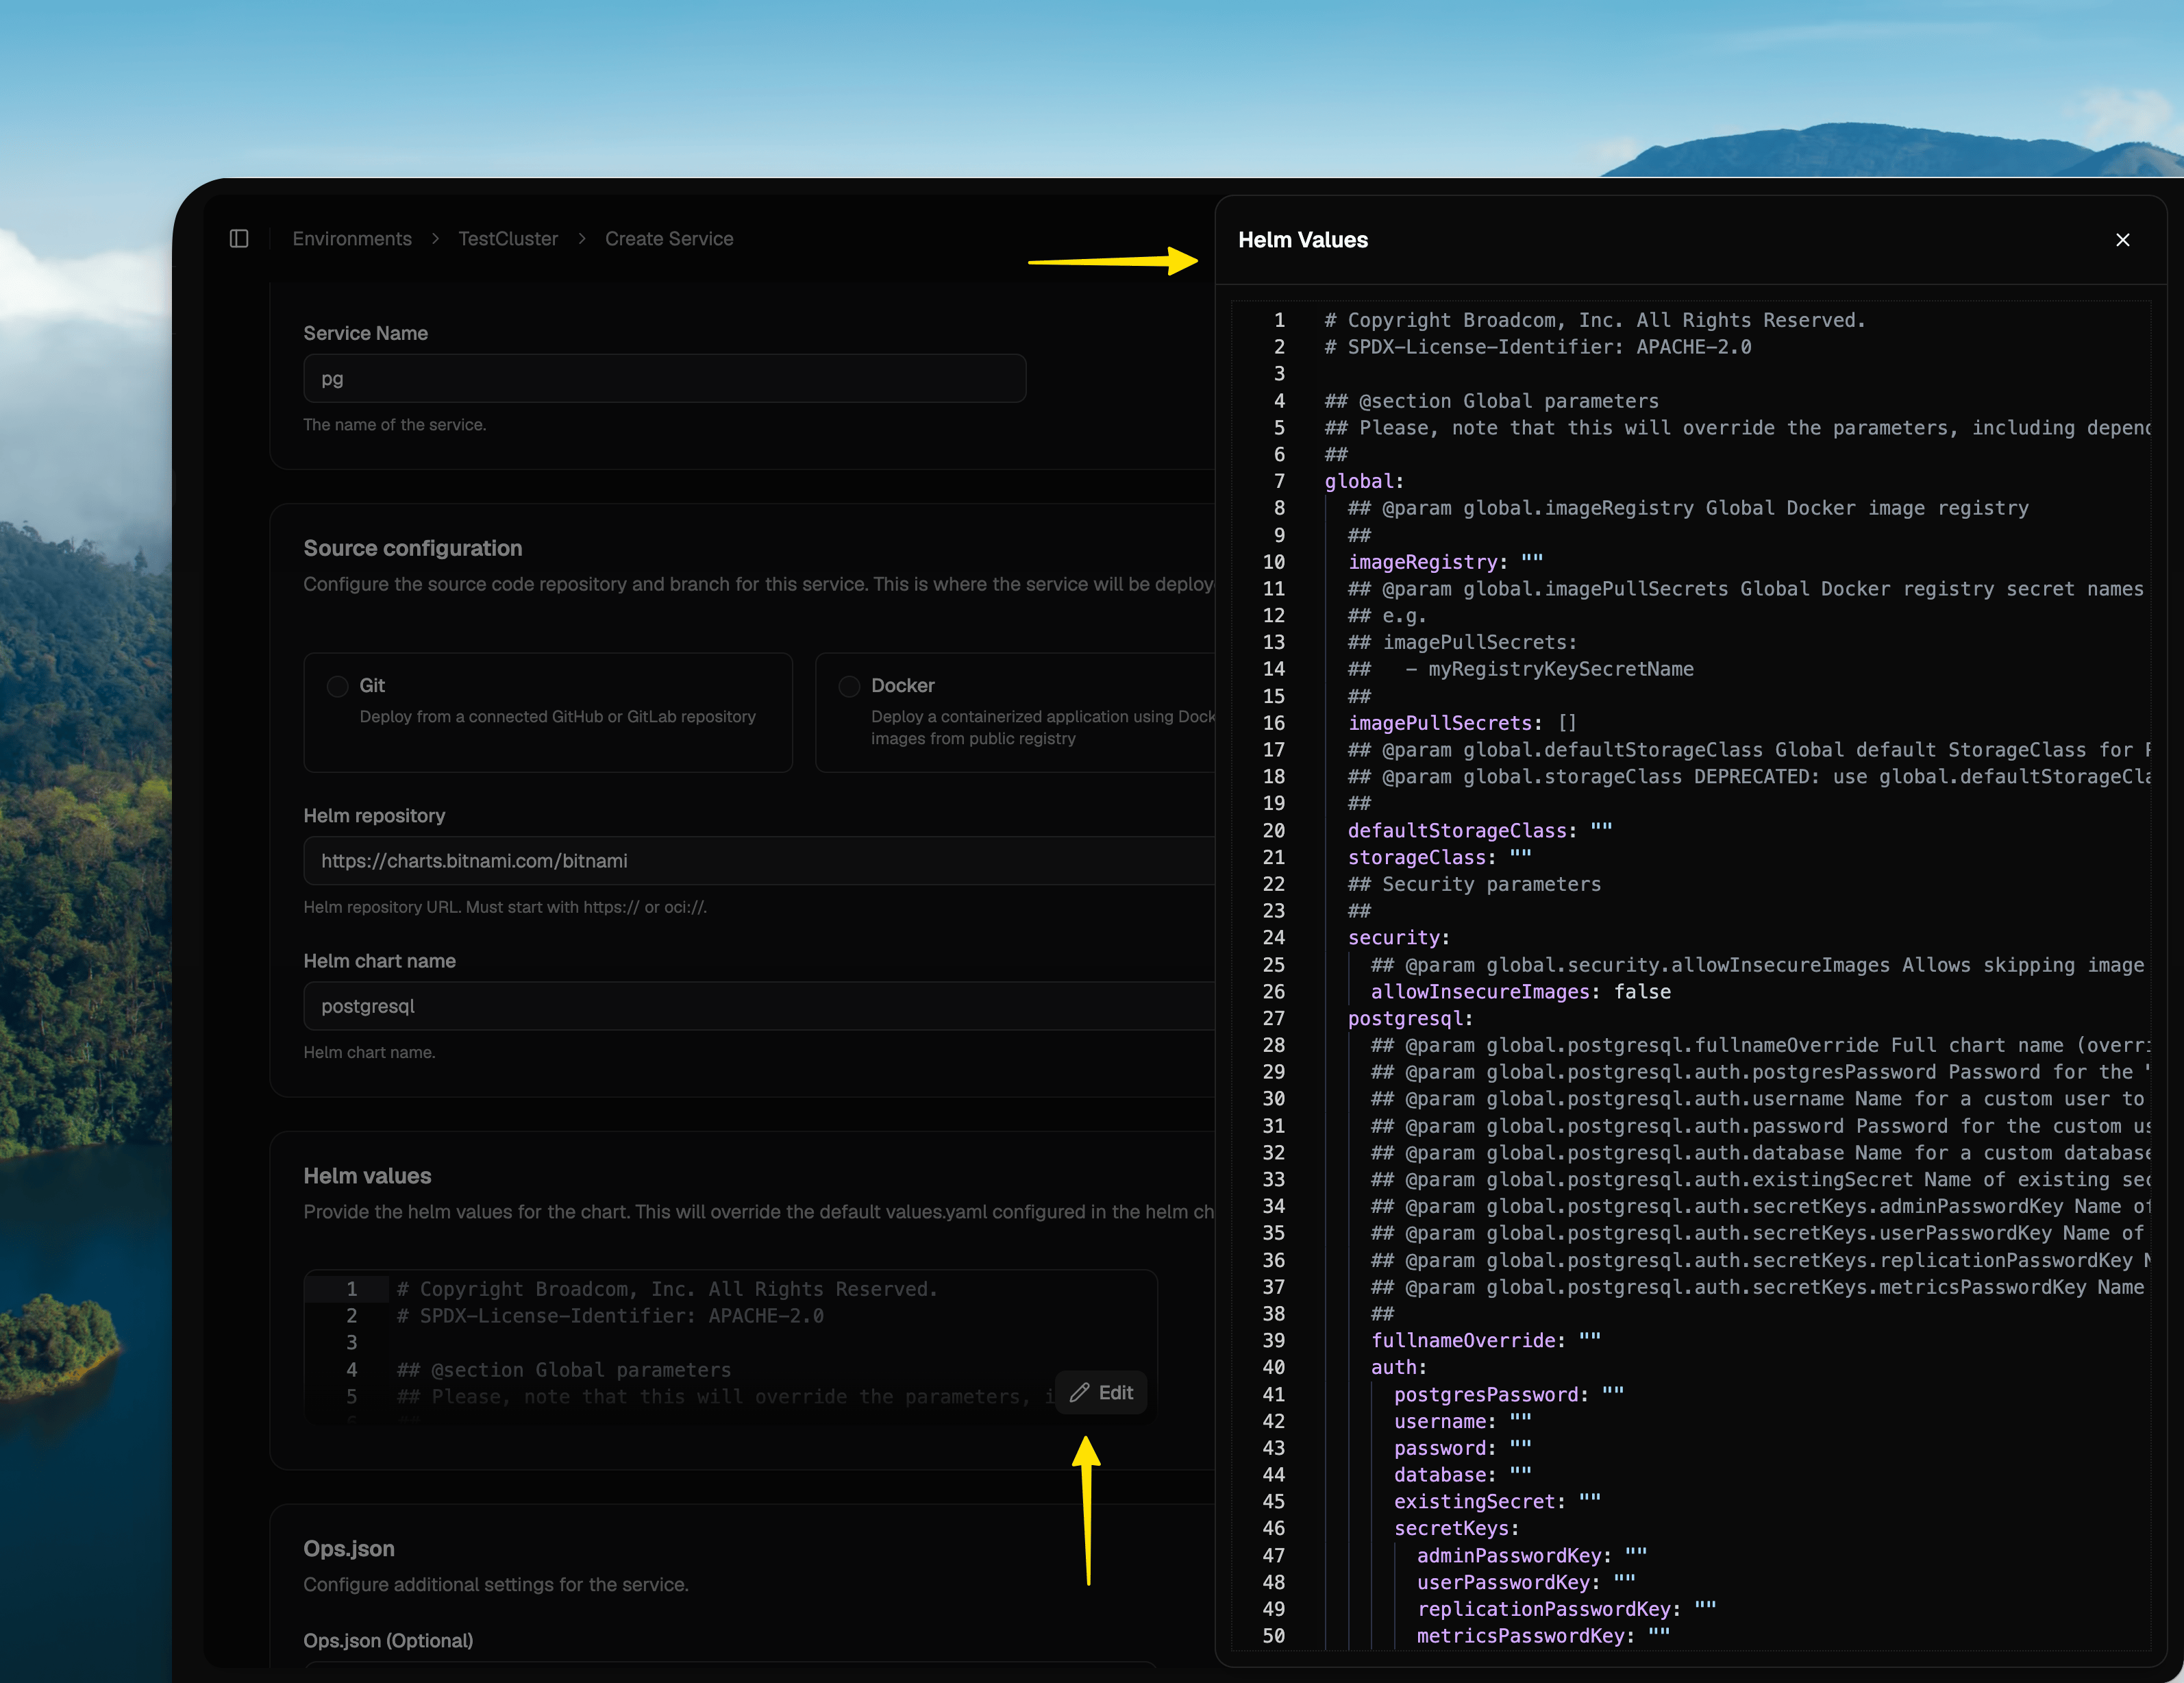
MySQL, Redis and Valkey in the CLI, and generate FedRAMP compliant Helm charts
ops connect and ops proxy now speak MySQL, Redis and Valkey
Reaching a database inside your environment from your laptop used to work for Postgres only. A service using MySQL, or
an ElastiCache Redis or Valkey cluster, needed a hand-rolled jump pod.Both commands now cover all of them:ops connect --dep starts a short-lived client pod inside your environment, hands it the same connection details your
service uses and opens that engine’s own prompt. Exit the shell and the pod is deleted:ops proxy --dep covers the same dependencies for a local GUI client - TablePlus, DataGrip, DBeaver or RedisInsight -
by relaying the private endpoint to a port on your machine and printing the credentials to use with it.--dep finds a database through its $dsn export and a cache through $endpoint, so your ops.json needs one of
them. Memcached clusters are not supported.See Connect to your databases or cache for naming a specific
dependency, overriding the client image, choosing a local port, and the SSL modes to use through a tunnel.Coming next: SQL Server. Support for SQL Server instances through the same --dep flag is in progress.Generate FedRAMP compliant Helm charts, with zero-CVE images
Teams operating under FedRAMP or NIST 800-53 ask two things of every Helm chart you hand them: can it run under therestricted Pod Security Standard, and what is inside the images.The Helm charts you generate support restricted. Generate a chart from the LocalOps console and distribute it to
your customers with a license token, which authenticates every pull of the
chart and its private images. Pod and container security options are exposed as values, so your customer sets Pod
Security Standards per deployment rather than patching the chart:ops.json control node level access through
unsafe.privileged.Questions? Email us at support@localops.co or ping us in your Slack Connect support channel.Public API - run environments on any cloud, headless
The LocalOps API is public. Everything you have been doing by clicking through the console - creating services, shipping them, rotating secrets, attaching domains - you can now do from code, with an account API token and nothing else.It is a small, deliberately separate surface from the console - every endpoint is listed in the API reference. Owners and admins can read the token from the LocalOps console, and every request carries it:API Token.Ship from your own CI
Create a service, then deploy a git SHA, a Docker image tag or a Helm chart version - and poll the deployment until it lands:{} to deploy the head of the service’s configured branch. The deployment id comes back immediately, and
GET /v1/deployments/{deploymentId} runs to success or failed.Manage secrets and custom domains
Read and replace secrets at the environment level or per service. Register a custom domain and the API hands back the exact DNS records to create, then verifies them and cuts traffic over.Wire your own infrastructure to an environment
GET /v1/environments/{envId} reads three things live from your cloud, so your DNS, firewalls and IAM policies can
point at a LocalOps environment without anyone copying values out of a console:ingress_host- what to point aCNAME(AWS) orArecord (GCP) atpublic_nat_ips- the egress addresses to allowlist in your firewalls and database security groupssvc_role_arn- the IAM role your pods assume, to name as a principal in your own bucket, queue and KMS key policies
Offer bring-your-own-cloud without a console step per customer
If you sell a BYOC edition - your product running inside each customer’s own AWS, GCP or Azure account - onboarding has meant repeating the same console steps for every customer: provision the environment, create each service, wire the secrets, attach the domain, deploy. For a dev tool company signing enterprise customers, that loop grows linearly with the customer list, and it is the part that does not scale.Here is the whole thing, end to end, as API calls. Once the customer has connected their cloud account, this is a script you run once per customer:- Provision an environment in their cloud.
POST /v1/environmentswith the customer’s cloud connection and the region they want -aws-us-east-1,gcp-us-central1, and so on. PollGET /v1/environments/{envId}untilstateisavailable. (This one endpoint is still coming soon - see below. Everything after it is live today.) - Add your services.
POST /v1/environments/{envId}/servicesonce per service - API, workers, cron jobs, frontend. Each one can come from a GitHub or GitLab repo, a Docker image or a Helm chart, with its own CPU, memory and replica counts. Adding a new service to a customer later is the same call. - Set their secrets.
PUT /v1/environments/{envId}/secretsfor values every service shares, andPUT /v1/environments/{envId}/services/{serviceId}/secretsfor the ones scoped to a single service. This is where per-customer configuration lives - their database URLs, their API keys, their license terms. - Deploy.
POST /v1/environments/{envId}/services/{serviceId}/deploywith a commit SHA, a Docker image tag or a Helm chart version. PollGET /v1/deployments/{deploymentId}untilsuccessorfailed. - Attach their domain.
POST …/custom-domainsreturns the exact DNS records for the customer to create, andPOST …/custom-domains/{customDomainId}/verifychecks them and cuts traffic over once they resolve. - Hand over the network details.
GET /v1/environments/{envId}gives you theingress_hostto point DNS at, the egress IP addresses to allowlist and the IAM role to name in their resource policies - the three things their network and security teams ask for during review.
success - a
staged rollout across your install base, written in whatever your team already uses.What is next
Per-operation status and logs, so a failure tells you why. Creating and deleting environments. Deleting a custom domain. Cancelling an in-flight deployment. All of them are already published in the API reference with aCOMING SOON badge, so you can design against them today - they return 404 until they ship.Next up: MCPs
This API is the foundation for what we are building next - a LocalOps MCP server, so your agents can deploy on your behalf.The same operations you have just read about, exposed as tools an agent can call: create a service, set its secrets, ship a release, check what state an environment is in. Ask your agent to stand up a service for a branch, roll a new image tag out to a customer, or tell you why last night’s deployment failed, and it talks to LocalOps directly instead of you translating the request intocurl.This and everything else we are working on is tracked on our
public roadmap.Get started · Common workflows · API referenceQuestions? Email us at support@localops.co or ping us in your Slack Connect support channel.New options in ops.json: bigger uploads, fewer surprise errors
We have raised the platform limits that teams most often hit when they onboard, so a normal app should now run without touching any of this. Four newops.json options let you set your own limits when your service needs more.request_body_size: bigger uploads work out of the box
Every environment’s ingress used to reject any request body over 1 MB, so an ordinary file upload came back as a
413 Request Entity Too Large before it ever reached your container. The platform now accepts 30 MB by default, in
line with what other hosting platforms allow.If your service takes bigger uploads - attachments, media, bulk imports - raise the limit yourself with
request_body_size, in whole MB:ops.json
proxy_buffer_size and proxy_buffers: fix 502s caused by large response headers
Apps that hand back long headers - SSO redirects, big session cookies, fat JWTs - could fail with a 502 Bad Gateway,
because the ingress reserved only a small buffer for a response’s headers. That buffer is now bigger by default, and you
can size it yourself when your app needs more:ops.json
proxy_buffer_size is the size of each buffer in KB and is the one that fixes the 502. proxy_buffers is how many of
them the ingress uses while streaming a response, and is usually fine left alone.
Read the docs.send_timeout, read_timeout and connection_timeout: slow requests get more room
The ingress waits longer before giving up on your service. Sending and reading now allow 120 seconds each, up from
60, and connecting to your container is capped at 10 seconds so a genuinely dead container fails fast instead of
hanging. Slow reports, large downloads and chatty websocket handshakes stop getting cut off for no obvious reason.You can still set send_timeout, read_timeout and connection_timeout per service, up to an hour.
Read the docs.deploy_timeout: give slow-starting services longer to deploy
A deployment waits 5 minutes for your new version to become ready, then fails. That is too short for services with large
images or heavy startup work, so you can now extend it:ops.json
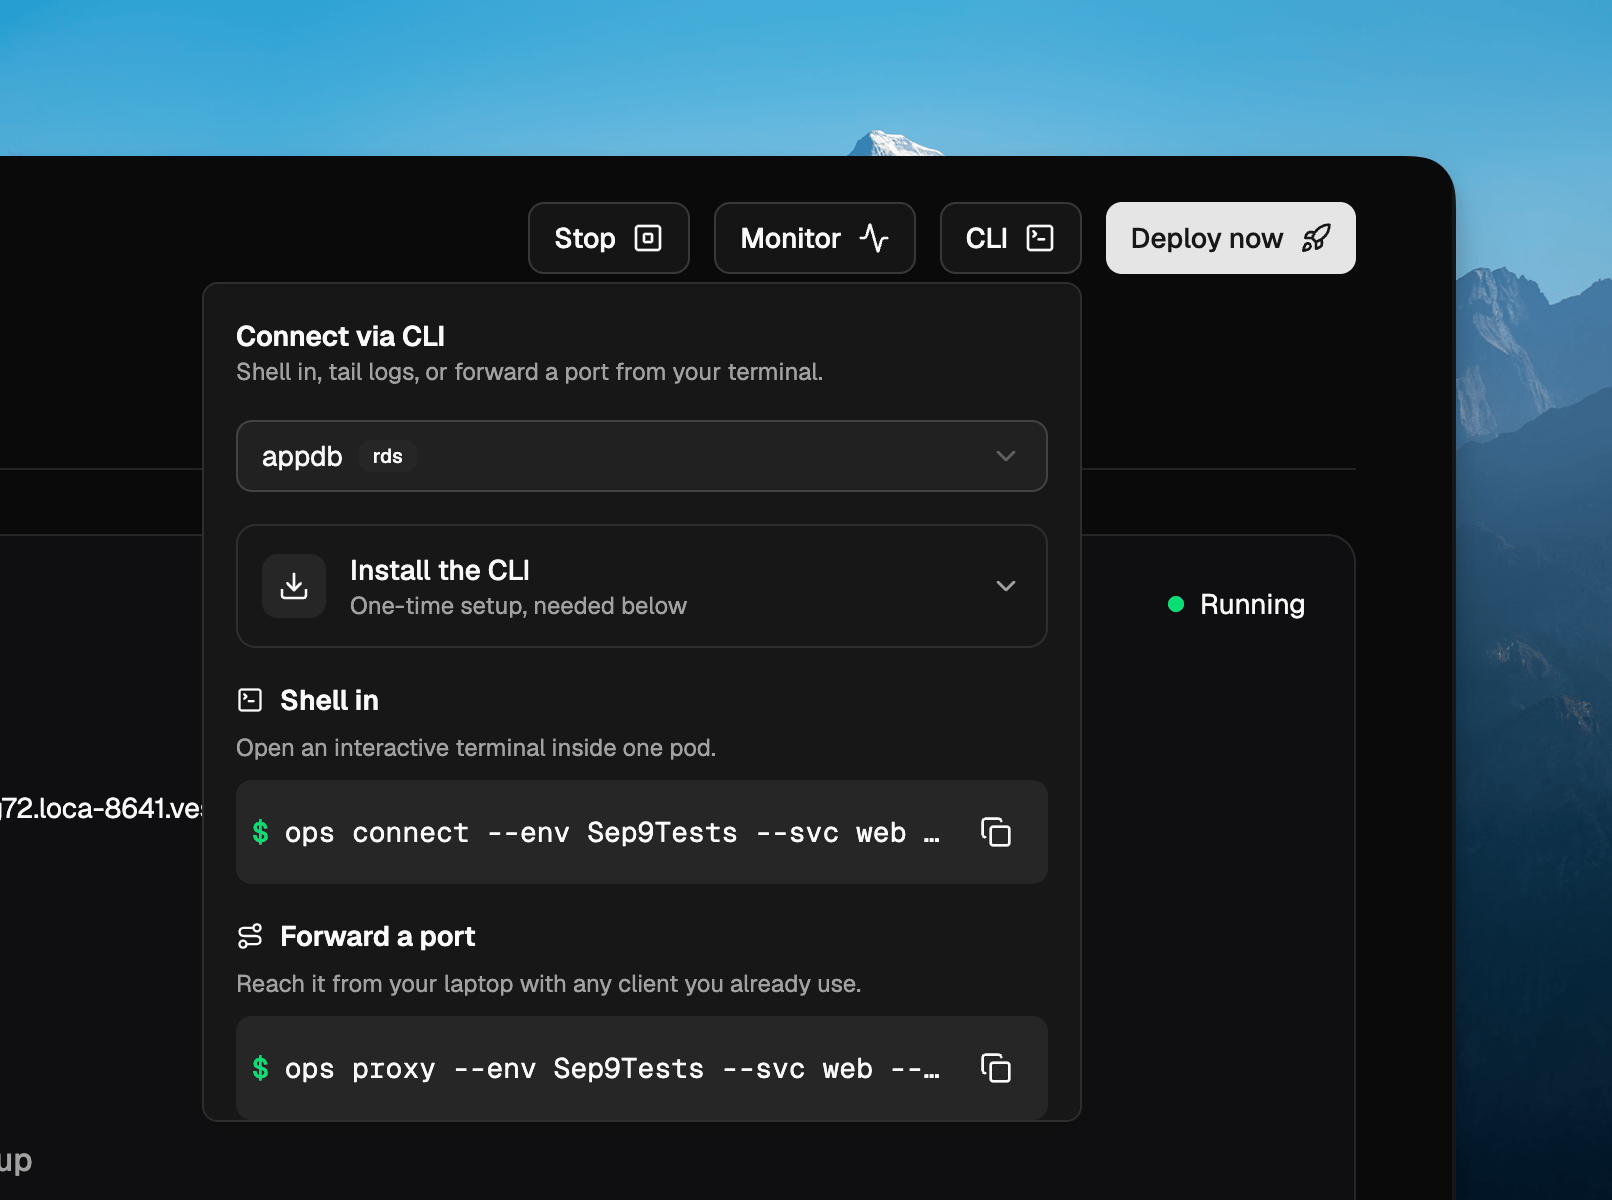
CLI v3.1.0 - Connect with pg shell or set up port forwarding
We added two new commands that let you connect to the RDS Postgres shell directly from your dev laptop. All without signing into bastion servers or any other step.New CLI menu
Install/upgrade to v3.1.0
Both commands ship in CLI v3.1.0. If you’re new to the CLI, install it with Homebrew and sign in:ops? Upgrade in place:-i. See the CLI docs for the full list, and for
the rest of the commands.Questions? Email us at support@localops.co or ping us in your Slack Connect support channel.CLI v3.0.4 — Shell into a service and tail its logs with one command
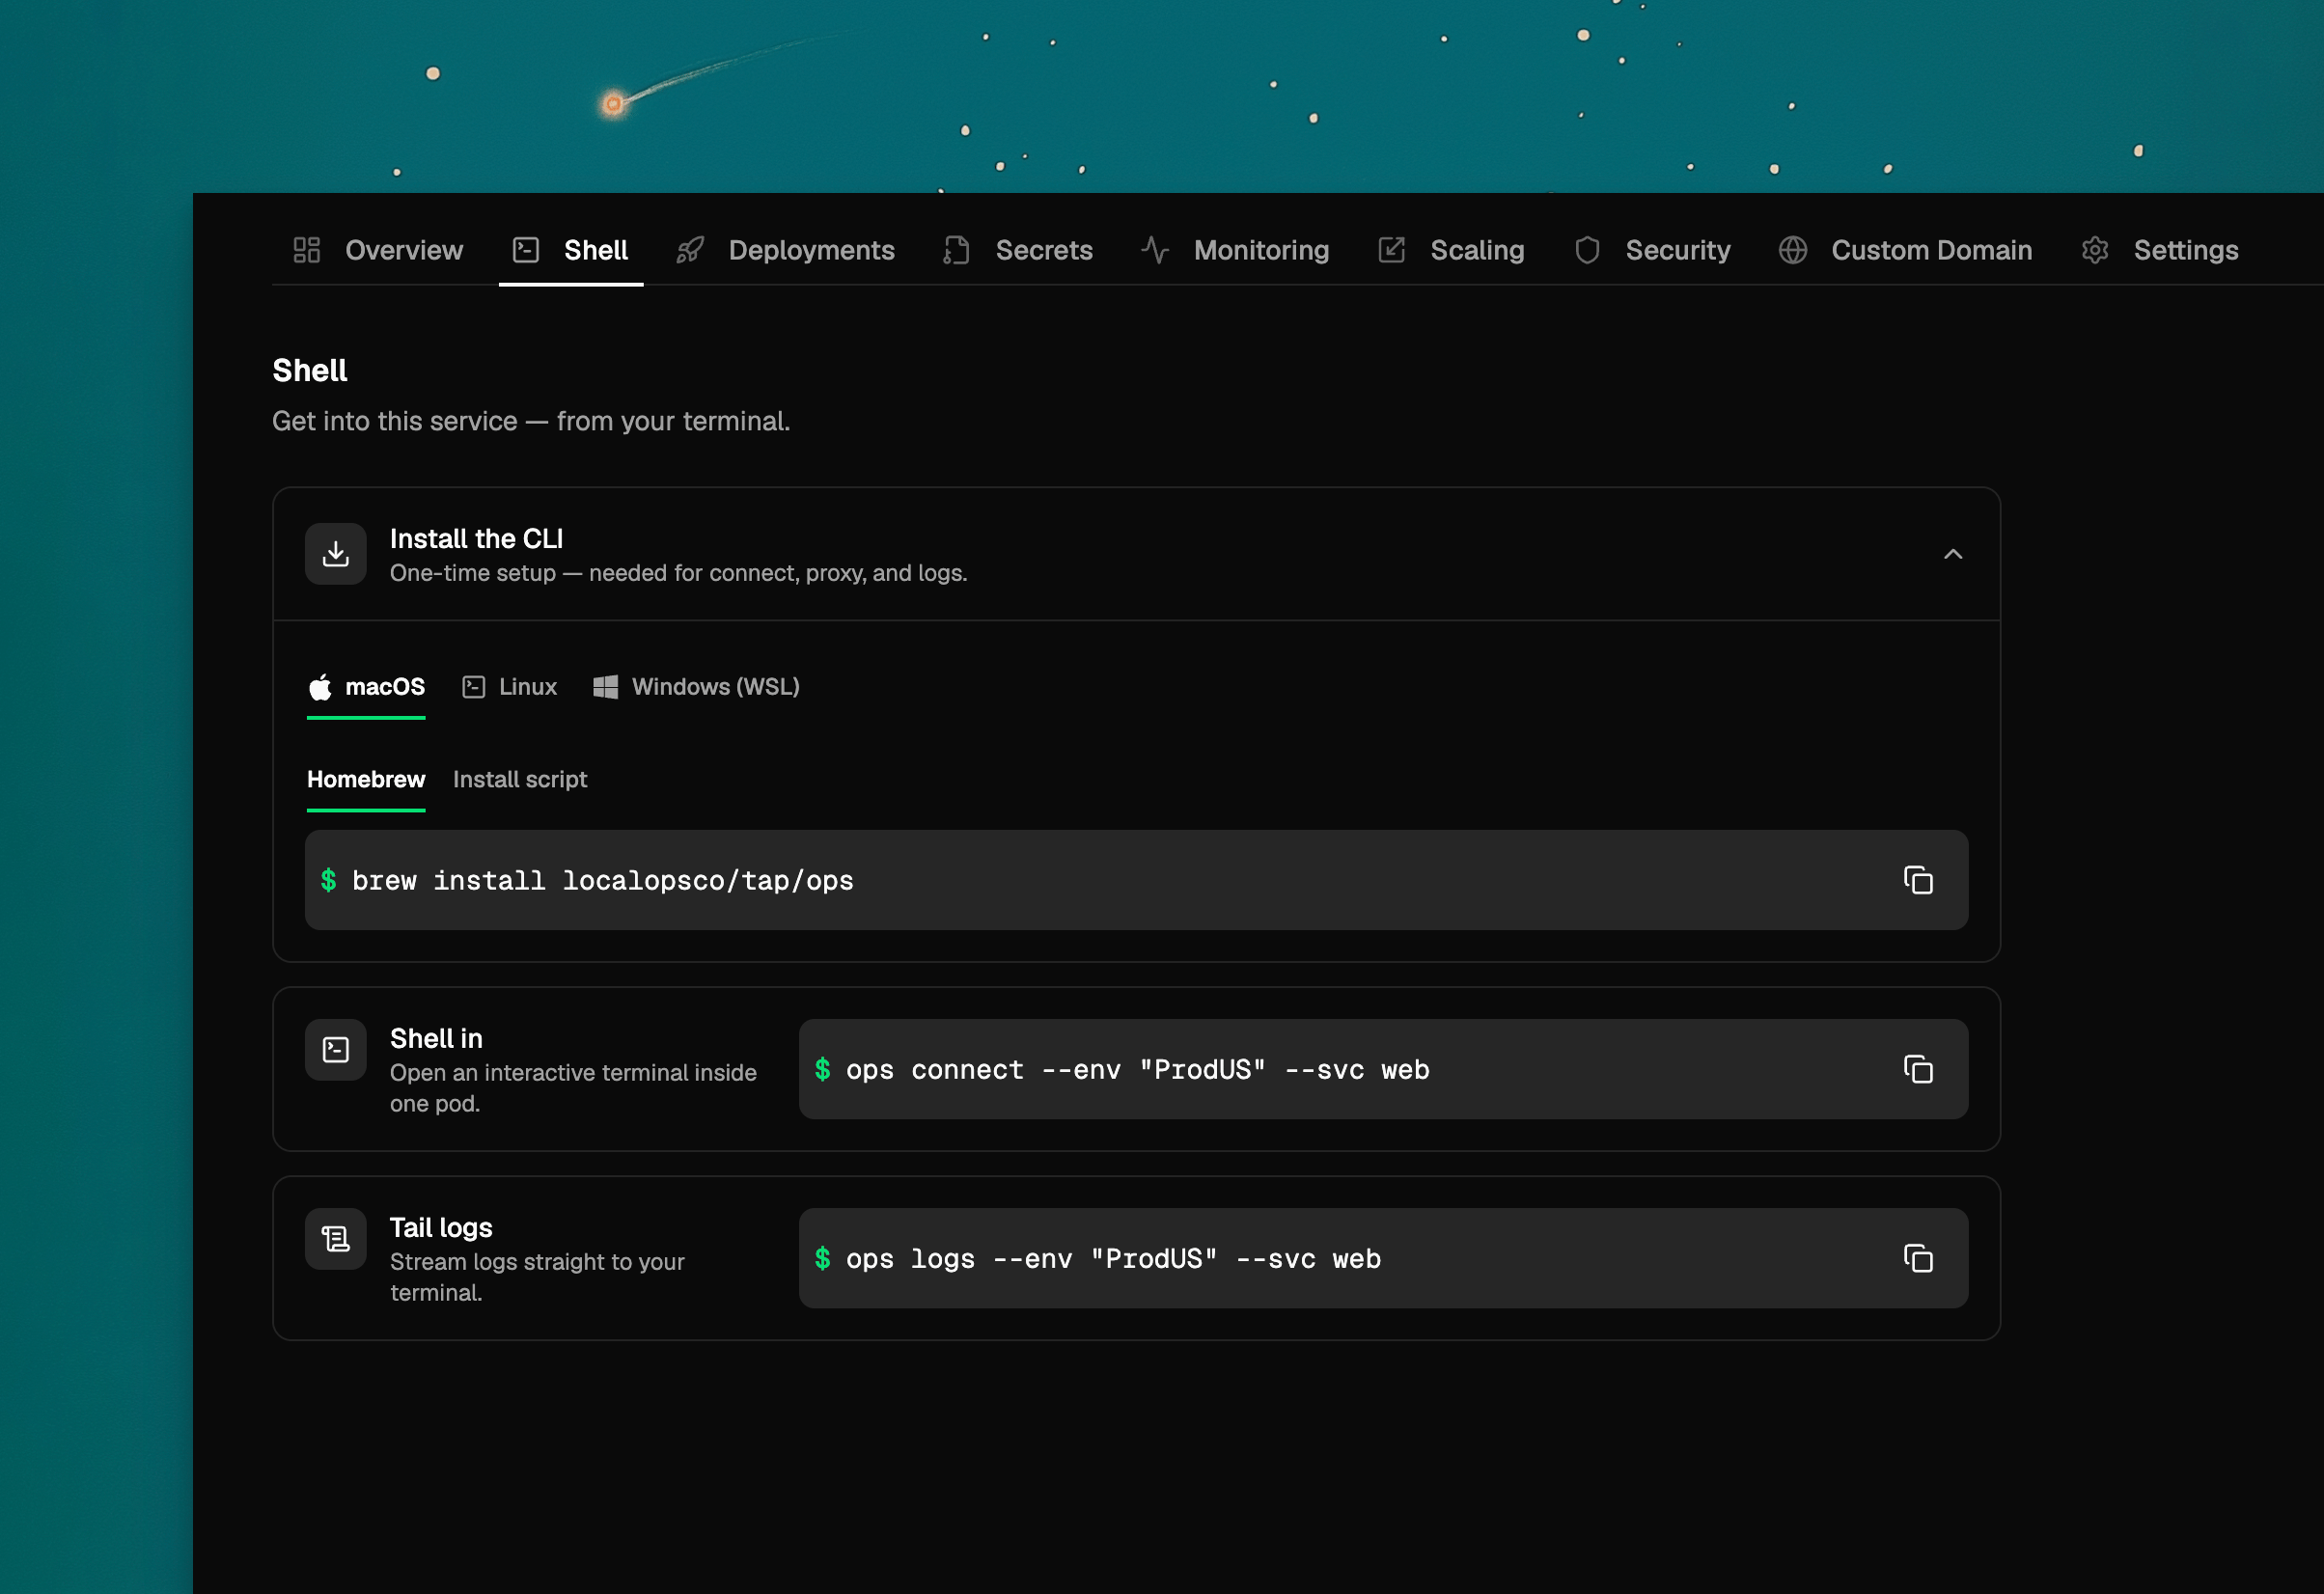
Getting a shell inside a running service used to mean pointing your kubeconfig at the environment, listing pods inapp-services and picking the right one before kubectl exec. Two new CLI commands cut that down to a single line
each.New shell tab
Install/upgrade to v3.0.4
Both commands ship in CLI v3.0.4. If you’re new to the CLI, install it with Homebrew and sign in:ops? Upgrade in place:-i. See the CLI docs for the full list, and for
the rest of the commands.Cluster your BEAM nodes across regions
Elixir services running in separate regional environments can now form a single cluster. Keepbeam_cluster_id
identical everywhere, and give each environment its own record in a private DNS zone that every regional VPC can
resolve:ops.json
LOPS_BEAM_CLUSTER_DNS, each peer region by its
beam_dns_name — and the mesh forms. The regional VPCs still need routable connectivity between them.
Read the docs.Questions? Email us at support@localops.co or ping us in your Slack Connect support channel.Monorepos fully supported with custom Build Context path
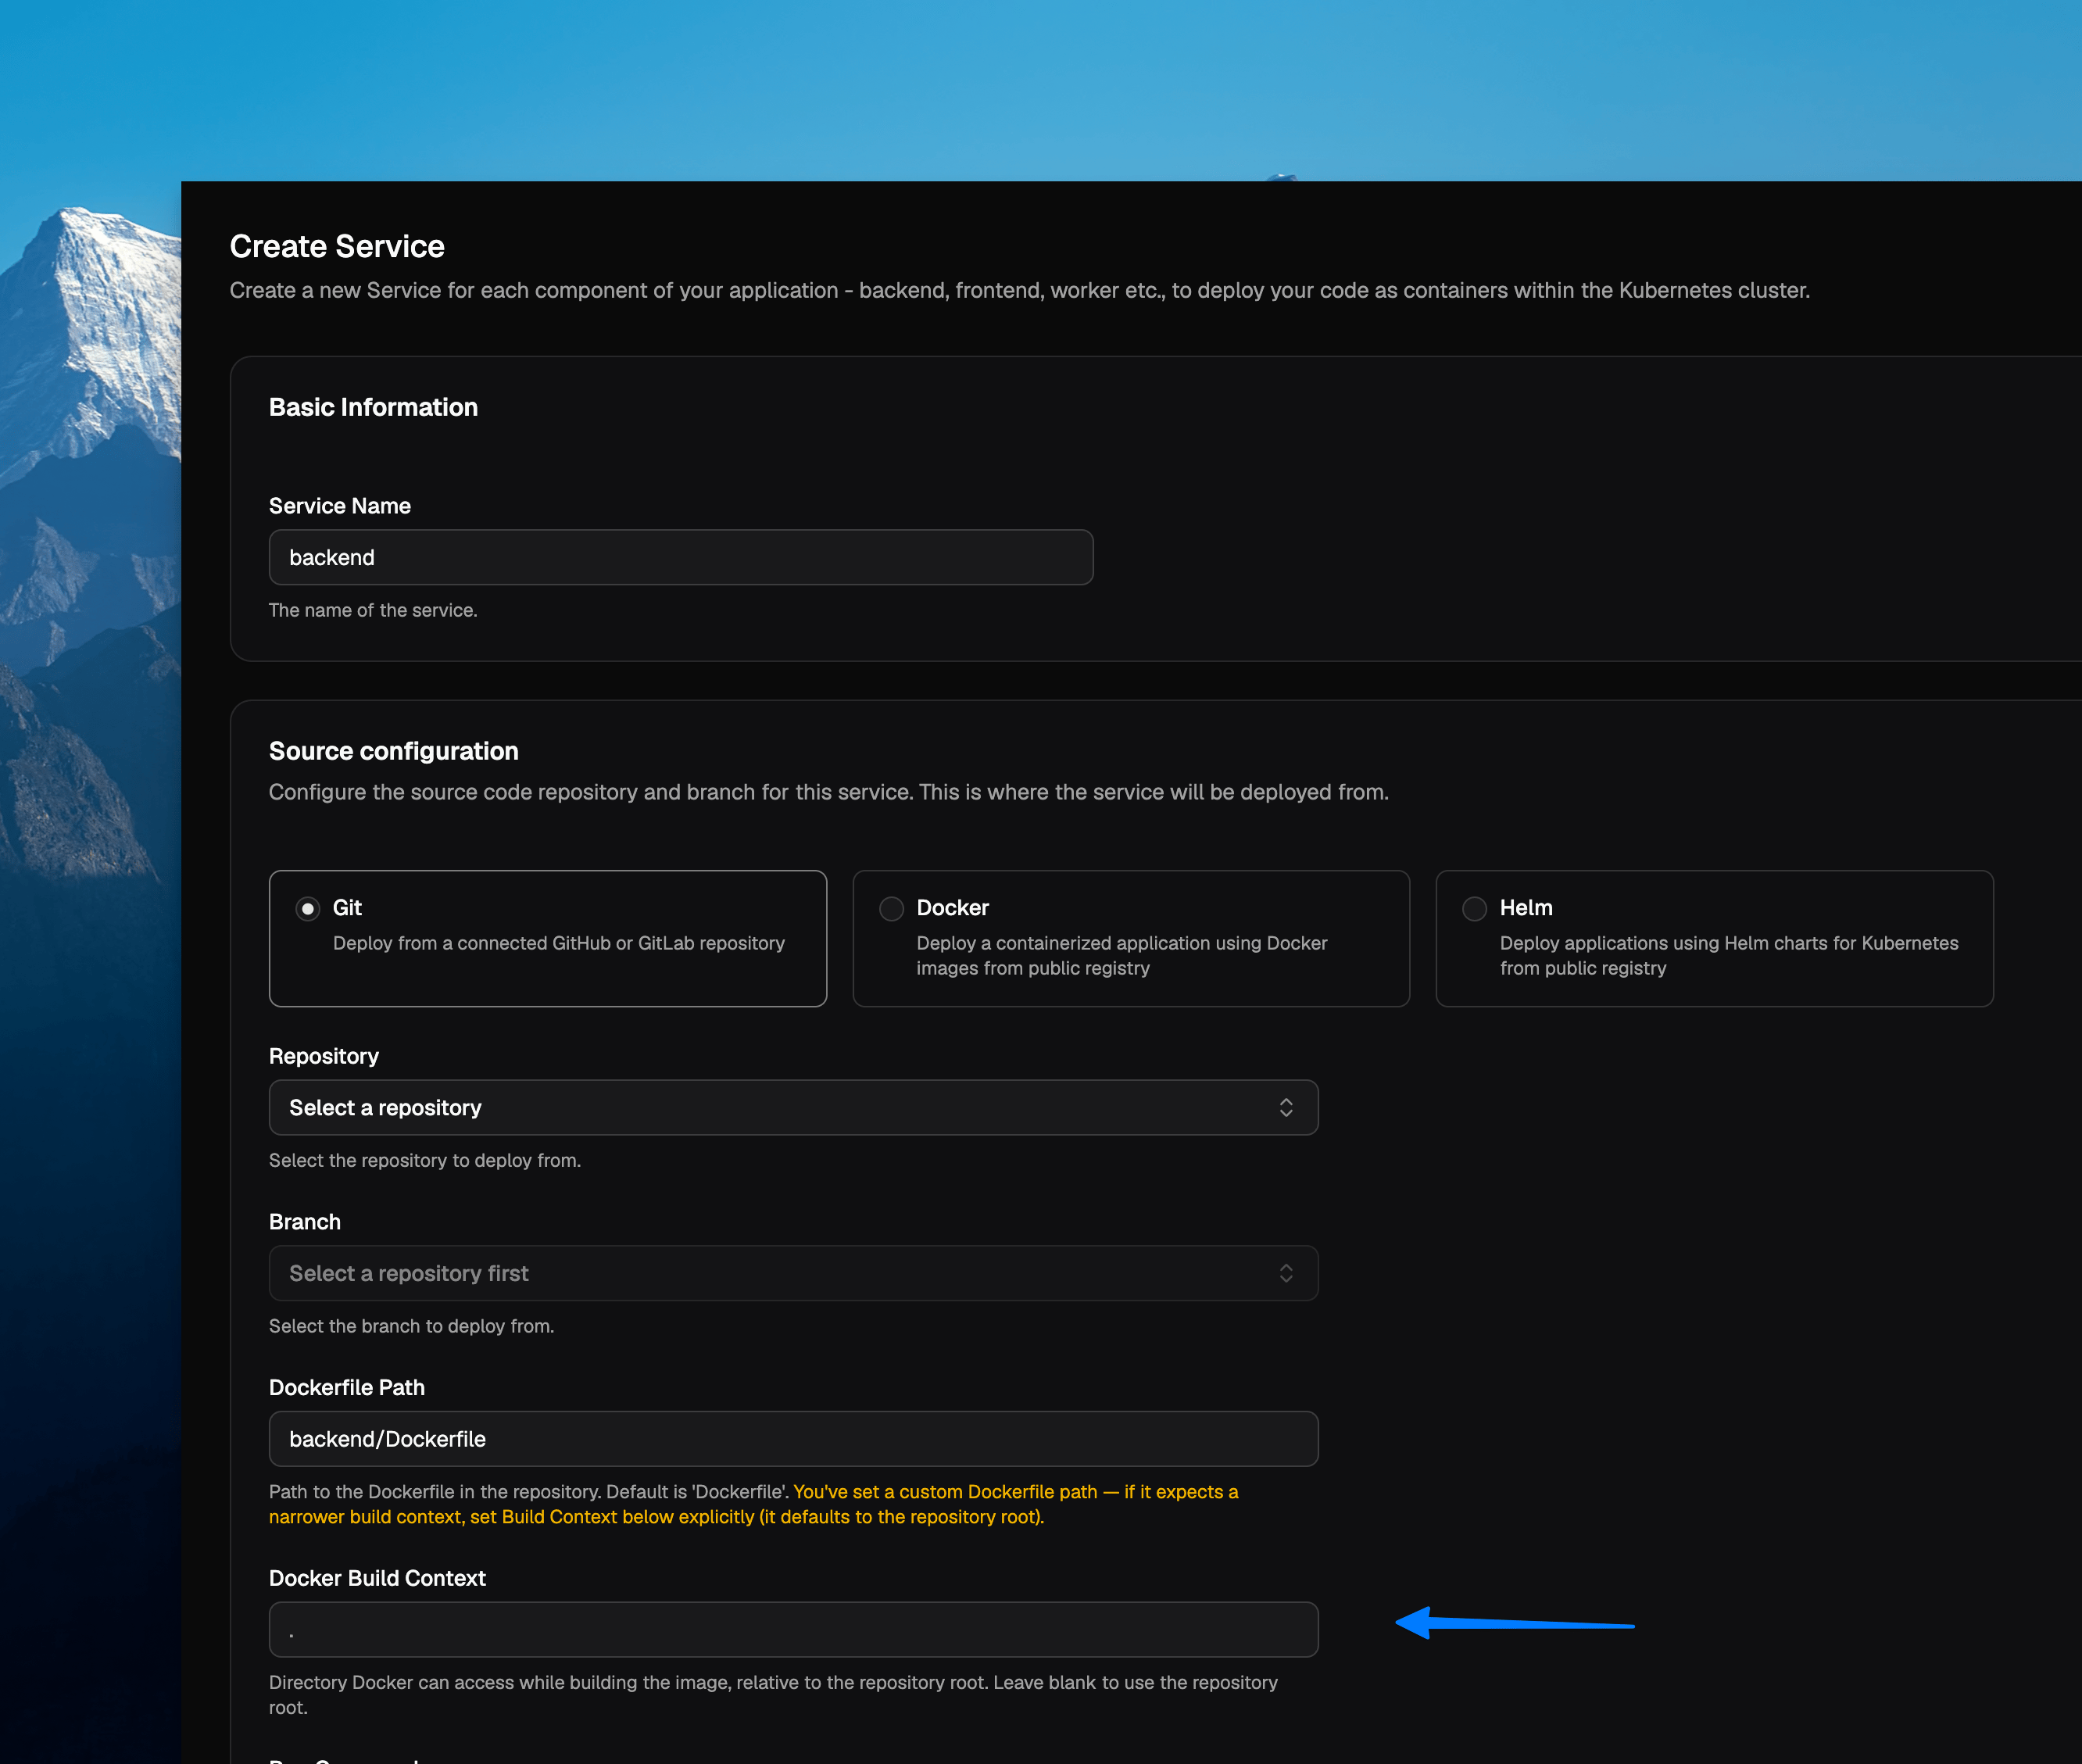
docker build from.
Either from the root of the git repo (default option), or from any other path.EKS control plane logs visible within Grafana
EKS clusters managed via LocalOps platform will now start to log all its control plane logs to CloudWatch which are in turn visible in the in-built grafana dashboard.So your advanced users get to understand how the underlying cluster works, whenever needed.Other enhancements:
- Increased project description length to let teams describe their projects in full
- Several security enhancements to zero out CVEs the 3rd party docker images
Persist data, mount certs, and grab scratch space
Your service may need scratch space for temporary files, a durable disk that survives restarts, or certificate files mounted at a well known path. Declare all three as volumes inops.json and LocalOps mounts them for you:mem is scratch discarded at shutdown — add a size to make it a RAM disk. disk is encrypted, persists across
restarts and gets one disk per replica. secret mounts a Kubernetes secret read-only, each key becoming a file. Disk
volumes aren’t available on cron and job services, and support covers AWS and GCP.The same declaration drives the Helm chart you generate for customers. Volumes marked expose: true land in the chart’s
values.yaml under persistence, so whoever installs it can size the disk or point at their own secret:Let your Elixir nodes find each other
Phoenix PubSub, a distributed registry, or any coordinated work across replicas needs your BEAM nodes to discover each other first. Add one field toops.json, using the same value in every service that belongs together:LOPS_BEAM_CLUSTER_NAME and LOPS_BEAM_CLUSTER_DNS injected at runtime — point libcluster’s
Kubernetes DNS strategy at the latter, and set RELEASE_DISTRIBUTION, RELEASE_NODE and RELEASE_COOKIE yourself.
Rebuild to apply, and note that previews cluster separately from production.
Read the docs.Run VMs inside your services on GCP
Firecracker microVMs, Android emulators, CI runners that build and boot disk images — workloads that need a real VM couldn’t run on LocalOps before, because the underlying nodes didn’t permit a guest hypervisor.Now you can enable nested virtualization on a GCP node group from the Node groups section, picking an Intel-based machine type, then assign the services that need VMs to it. KVM is available inside the container, so anything shelling out to QEMU/KVM behaves as it would on a bare VM.Questions? Email us at support@localops.co or ping us in your Slack Connect support channel.Restrict who can reach your services with IP allowlists
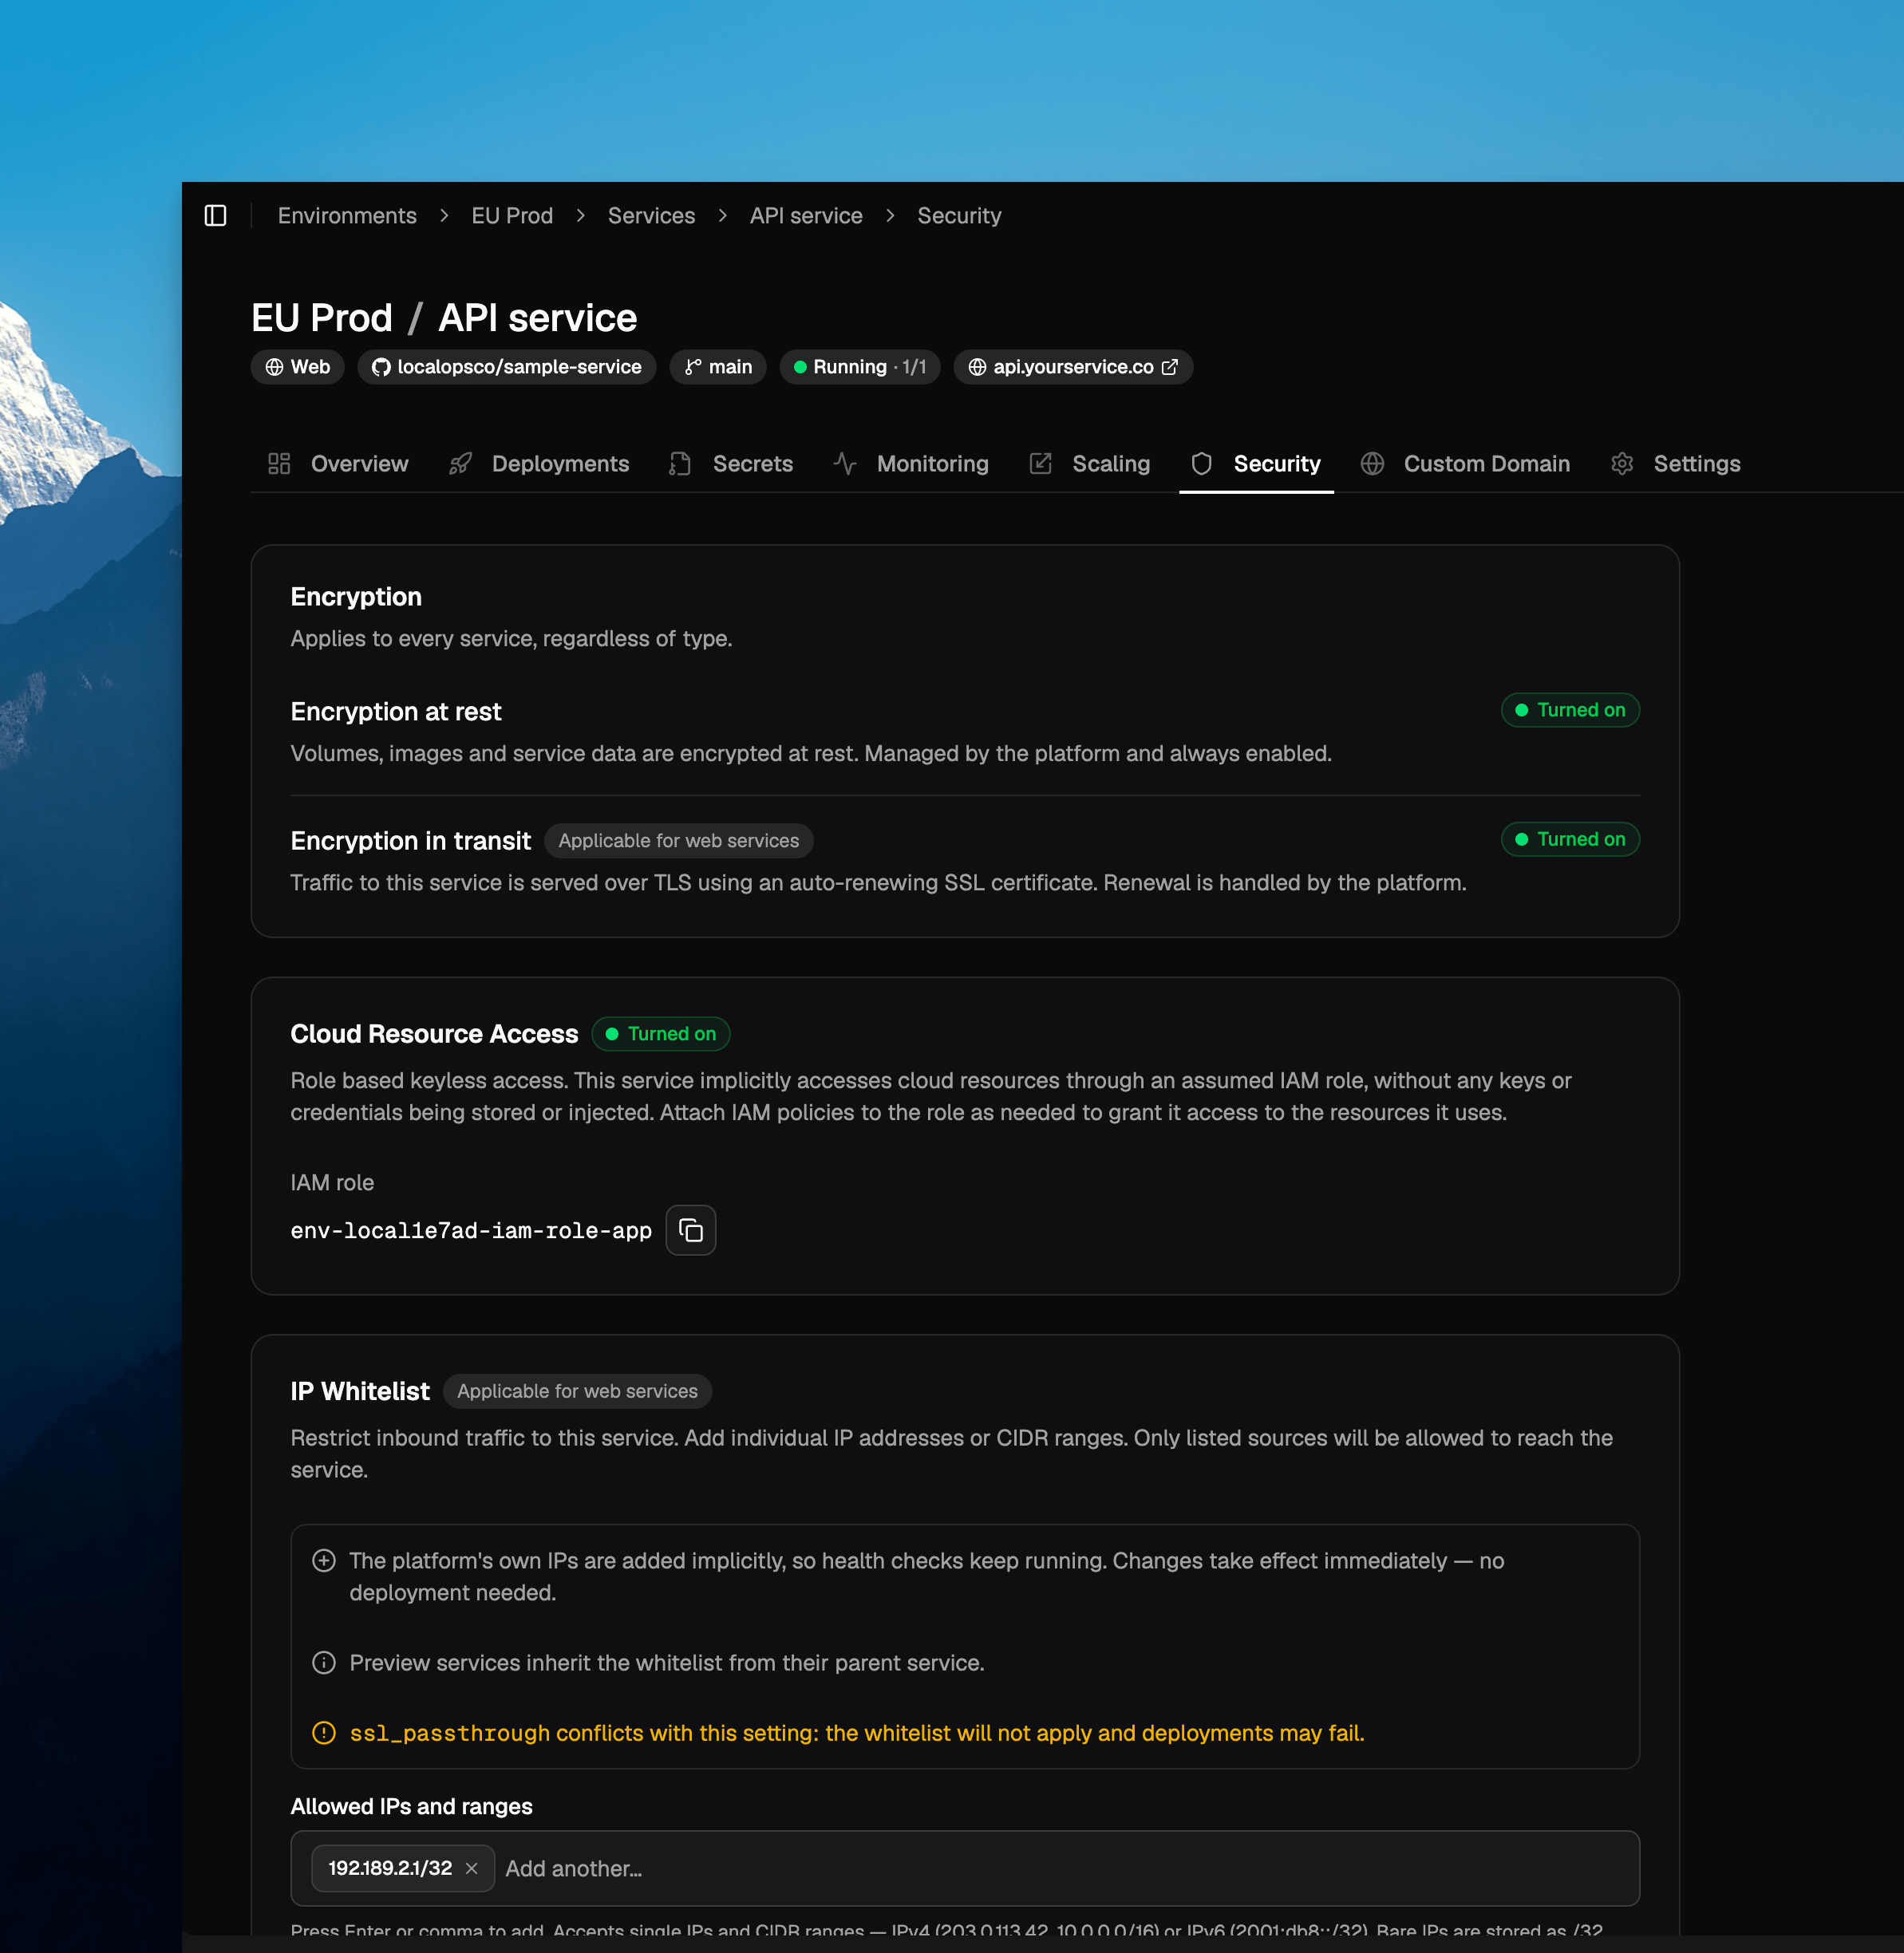
Preview services and cloned environments
Preview services inherit the allowlist from their parent service automatically, so a locked-down service stays locked down across its previews. Cloning an environment also copies each service’s allowlist to the clone. Neither needs anything from you.Questions? Email us at support@localops.co or ping us in your Slack Connect support channel.Passing secrets securely for Helm Charts
Secrets section is now available for Helm Chart services too!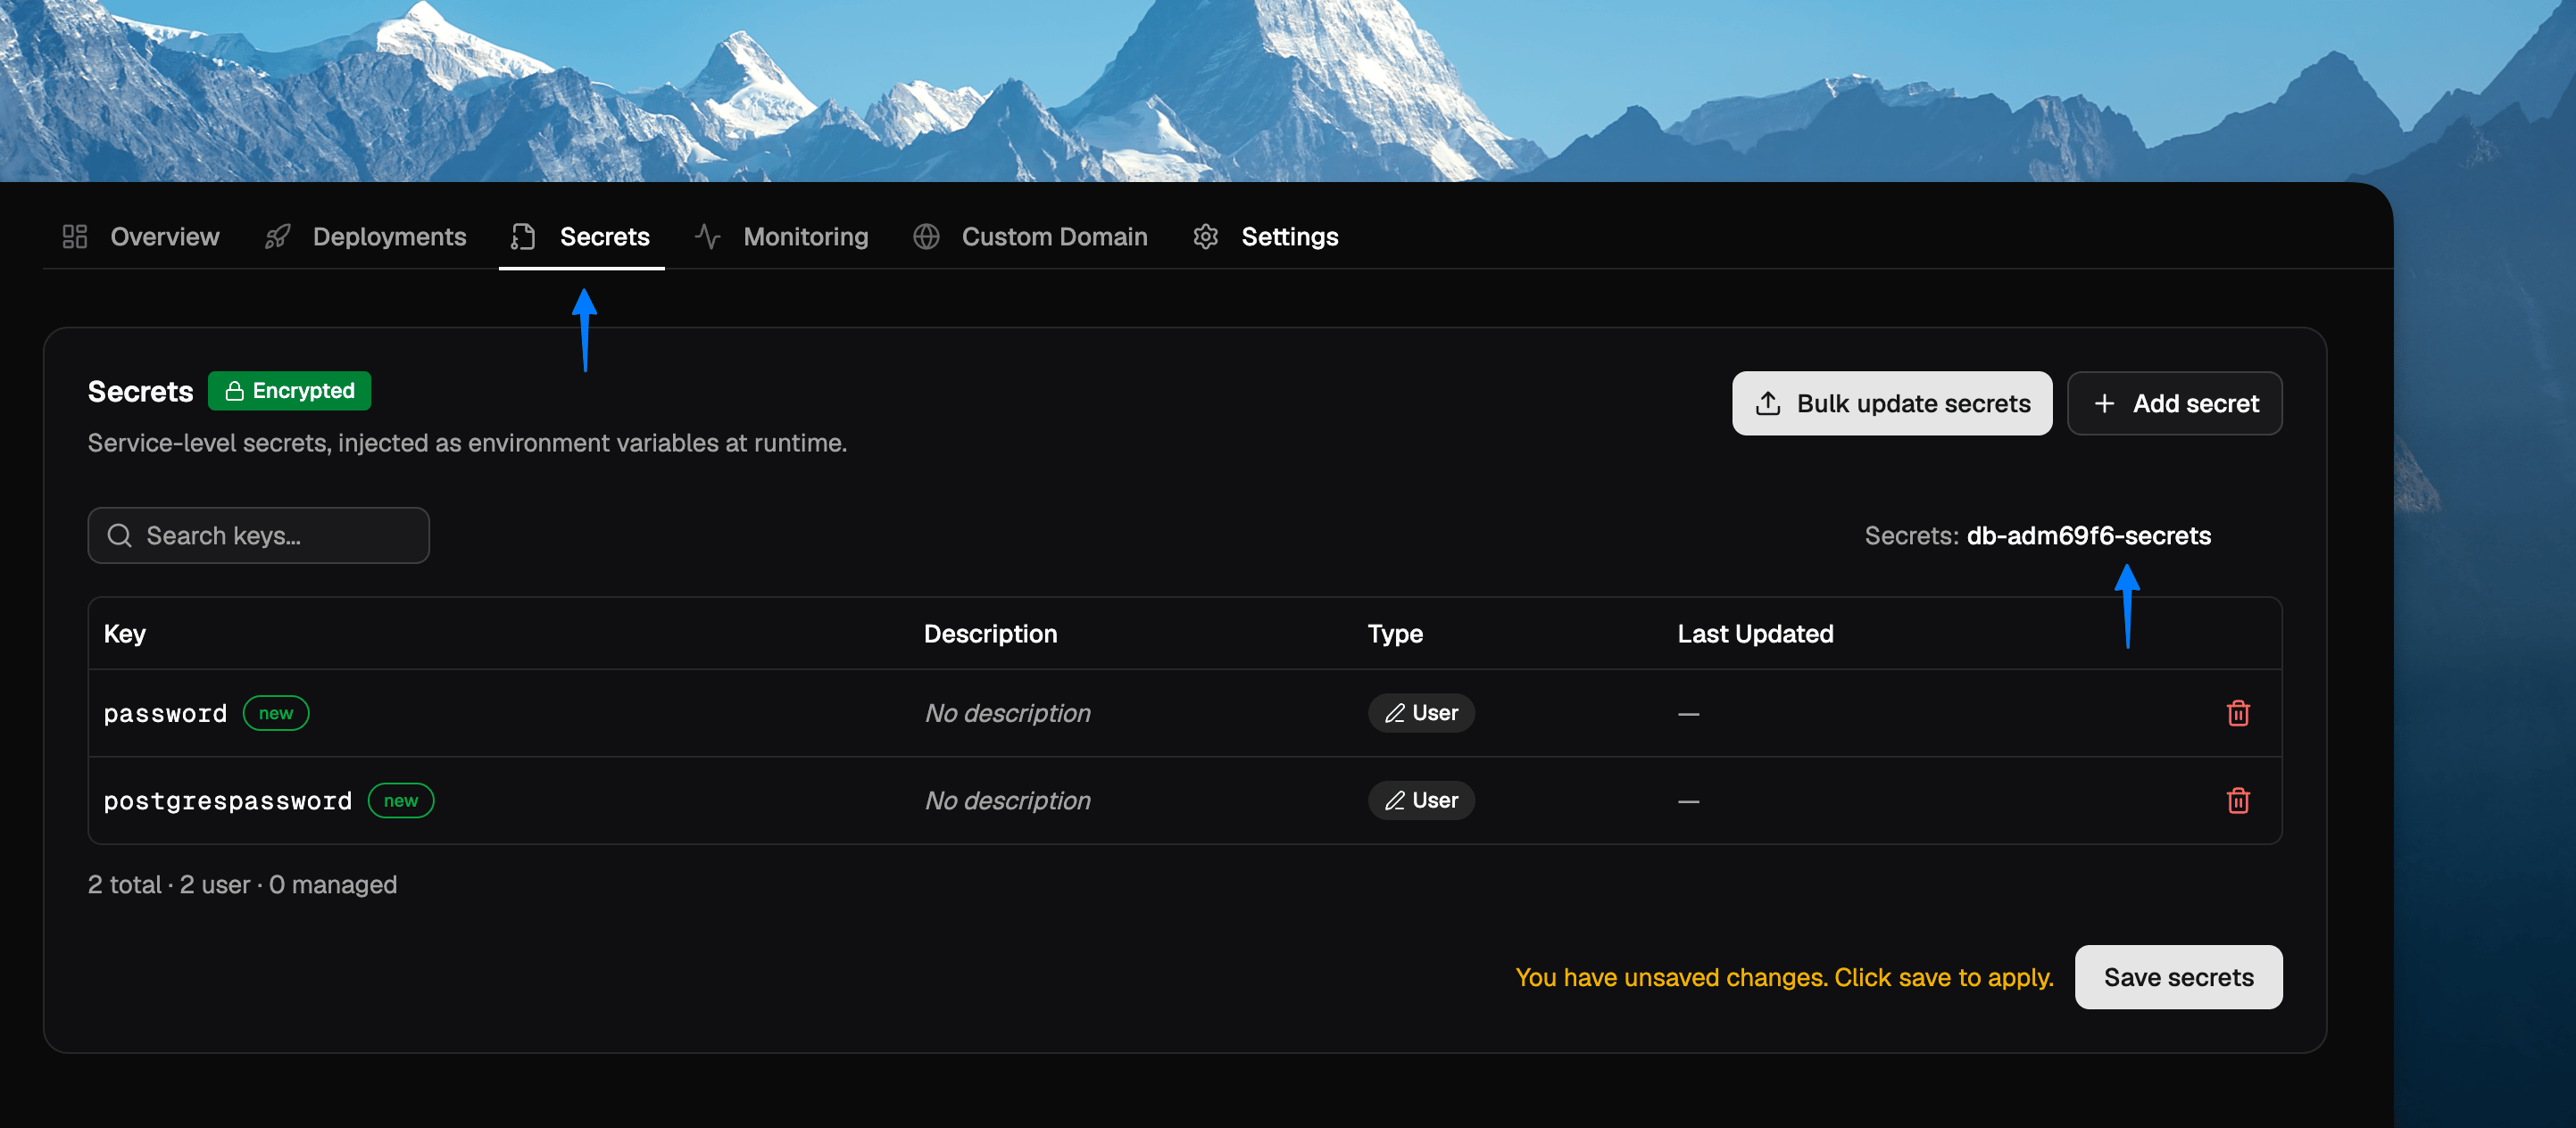
existingSecret name in secrets section.…instead of passing them in plaintext like this:Custom domain for chart services
Say your helm chart exposes services to the public world. For eg - you’re self-hosting Supabase which has a dashboard that must be exposed to the world.New “Custom domain” section in the service dashboad will now provide instructions on how to expose this service.Questions? Email us at support@localops.co or ping us in your Slack Connect support channel.New search bar
Managing more than a handful of services in your environment?Checkout the new search bar in services section that lets you search for services by their name or branch name or anything you remember about them.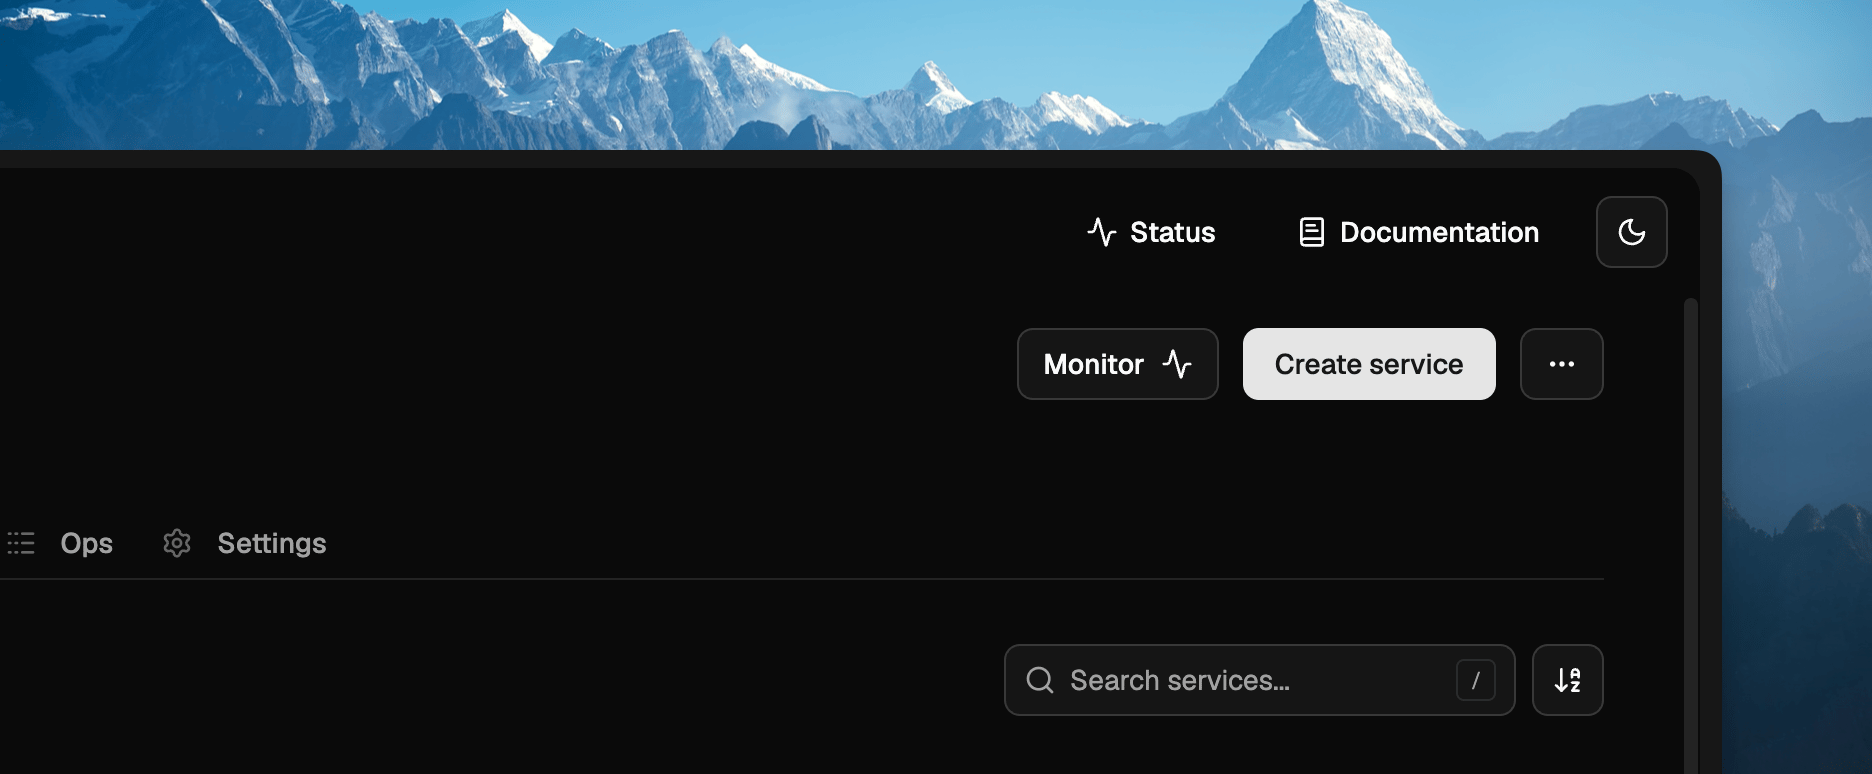
New demo section
When users sign up for first time, they are greeted a new brand new demo section that takes them live through the core product UX in just 2 mins.- create environment
- deploy services
- repeat!
Bug fixes
We sent a bunch of fixes this time, as reported by our users:- Fixed an issue where console refreshes adhoc when picking a repo in service form
- Hide the replica count when service is stopped and avoid showing “0/0” as count
- Post service creation, showed an appropriate message to ask user to deploy with correct branch name
- Allowed user to picker large cpu and memory rquirements for their service(s) under Scaling tab
- Several other minor bug fixes and UI refinements throughout the console
Environment cloning fixes
A few fixes to make cloning an environment more reliable:- Clone environments across projects. You can now clone an environment into a different project, not just within the same project — handy for promoting a setup from one project to another.
- More reliable global secrets page. The global secrets page in a cloned environment now loads consistently on the first try instead of occasionally appearing empty, and the page stays safely locked until your secrets have fully loaded.
- Service references in
ops.jsonare now rewritten correctly. When you clone an environment, service alias references (e.g.$svc-123) inops.jsonare updated to point at the corresponding services in the new environment — matching how secrets are already remapped. - Helm charts are no longer skipped. Helm-based services are now reliably included when cloning an environment, instead of occasionally being left out.
Lots of little fixes (and some tighter access control)
Team and account management endpoints now enforce owner/admin roles. Inviting or removing members, cancelling invitations, changing member roles, listing members and invitations, managing API tokens, registry and license-token access, and account domain changes are all now restricted to owners and admins. Members without the right role receive a clear permission error instead of the action going through.Clearer error messages
- Domain verification failures now return a specific
DOMAIN_VERIFICATION_FAILEDerror instead of a generic 4xx, so you can tell exactly what went wrong. - Verbose internal authentication validation errors are no longer surfaced in API responses, keeping error output clean and actionable.
Fixes
- Environment creation could sometimes fail in fresh Google Cloud projects — this has been fixed.
- Private instance lookups and updates are more robust — consistent handling of not-found instances and a fix for an edge case when updating an instance with no changed fields.
- Fixed the LocalOps CLI rendering CLI flags: the Geist Mono ligature no longer swallows the space before double-dash
(
--) flags.
deploy at 2am, thanks us.Questions? Email us at support@localops.co or ping us in your Slack Connect support channel.Google Cloud support
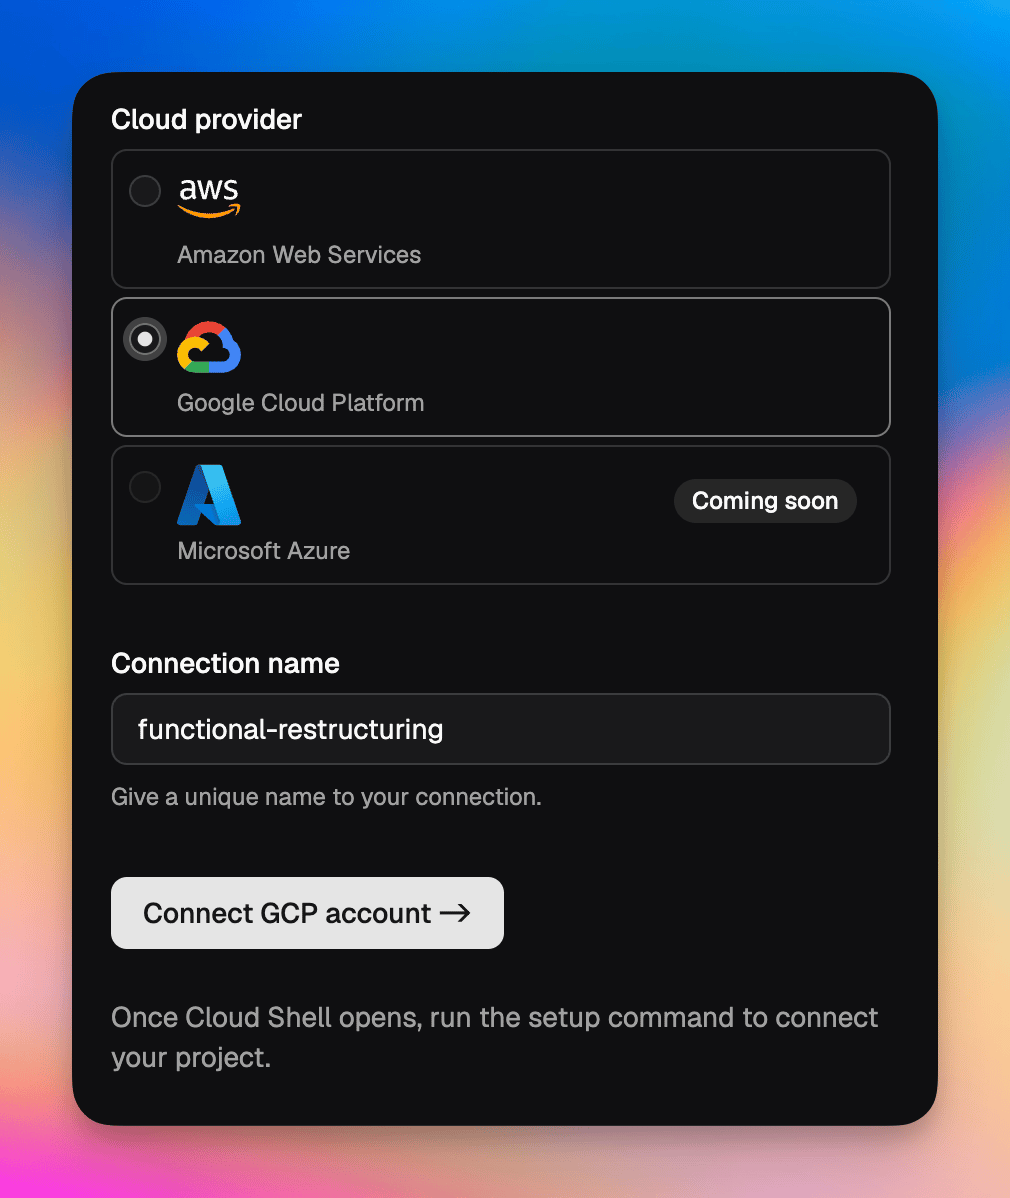
Update the CLI to v3.0.3
To use Google Cloud support, update the LocalOps CLI to v3.0.3. See the CLI install guide for how to update.Questions? Email us at support@localops.co or ping us in your Slack Connect support channel.GitLab support
You can now connect your GitLab repositories to LocalOps and enable continuous deployments on any cloud — your own cloud or your customer’s cloud. Once connected, every push triggers a deployment through the same pipeline you already use, so GitLab-hosted teams get the full BYOC, single-tenant and self-hosted experience without changing where their code lives.Changelog for each Helm chart version
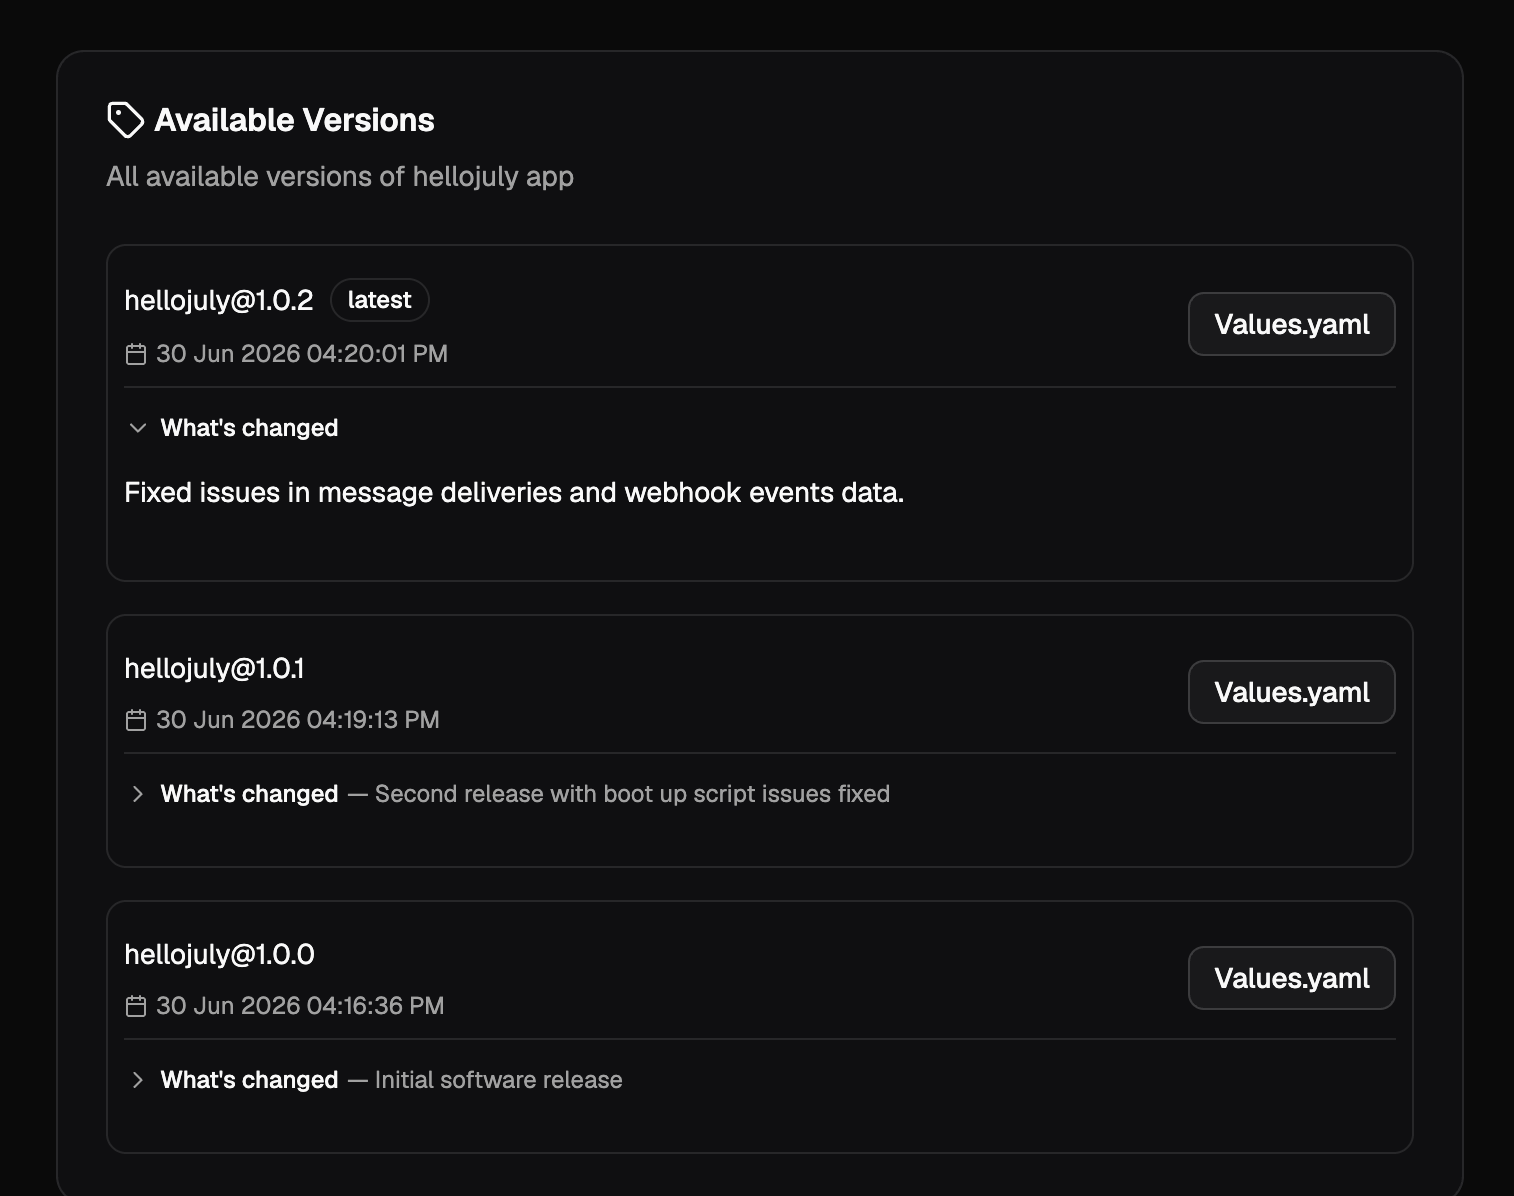
When generating a Helm chart, you can now add a changelog describing what changed in that version. The changelog is optional, supports Markdown, and appears in the chart’s release history — so the teams installing your chart can see exactly what each version brings.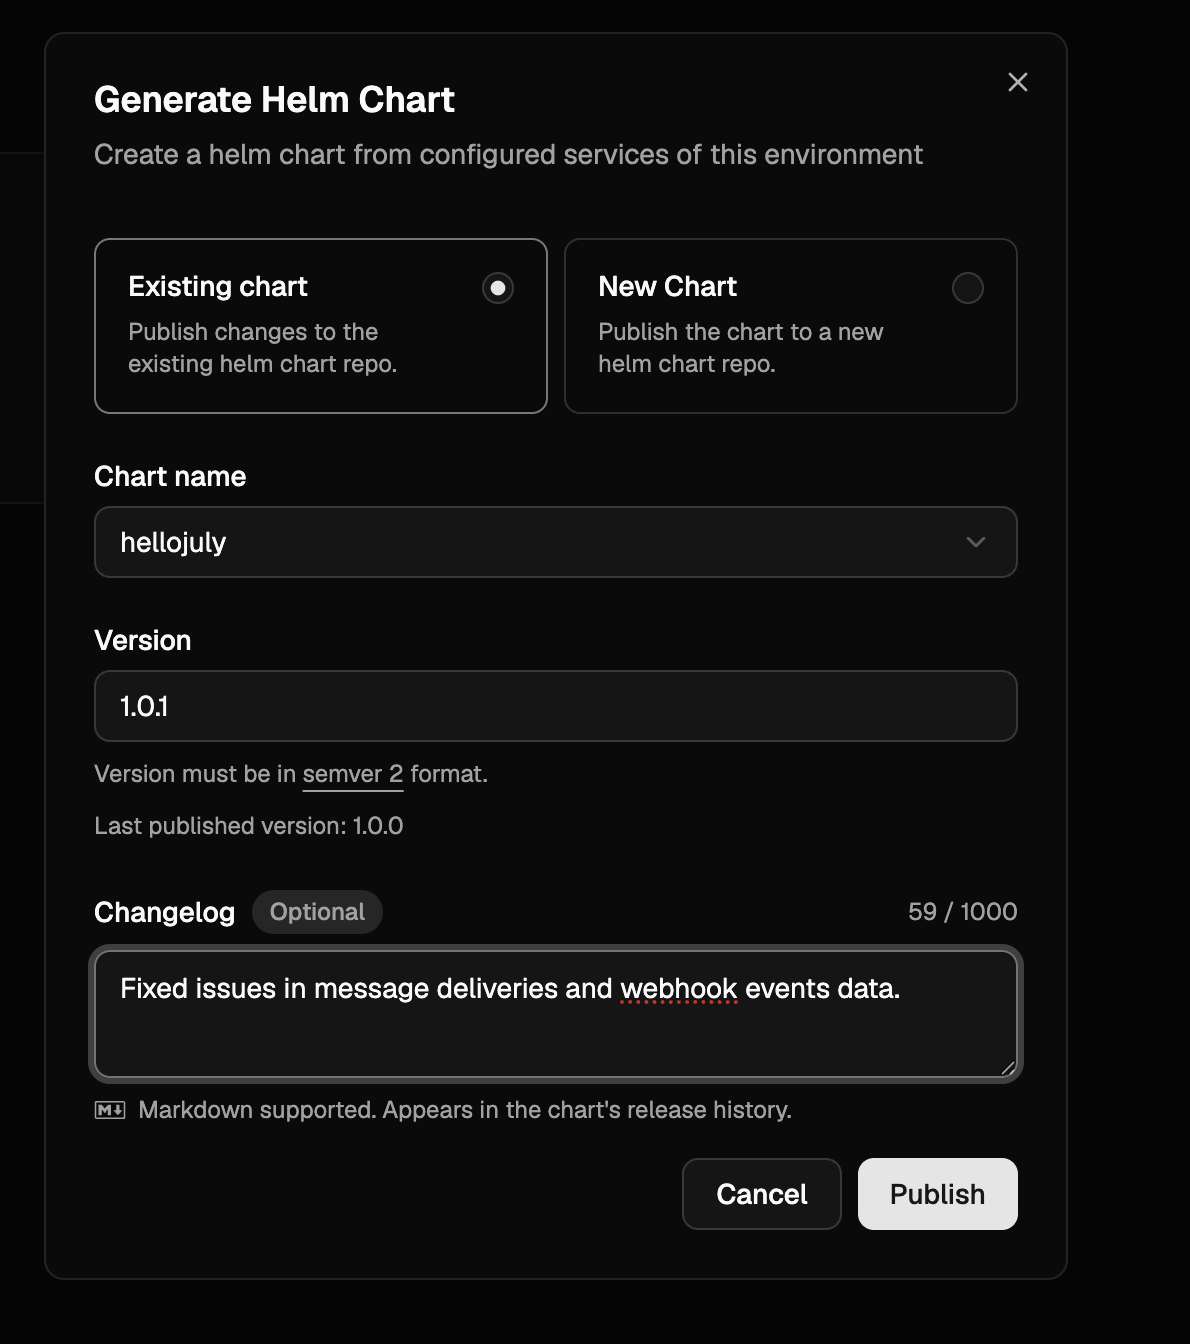
New warning when marking a Helm chart field as non-sensitive
When editing a Helm chart’s values in the console, switching a previously sensitive field to non-sensitive now prompts a confirmation dialog listing every affected key. This guards against accidentally exposing credentials or other confidential data — once a value is marked non-sensitive, it is stored and rendered in plain text.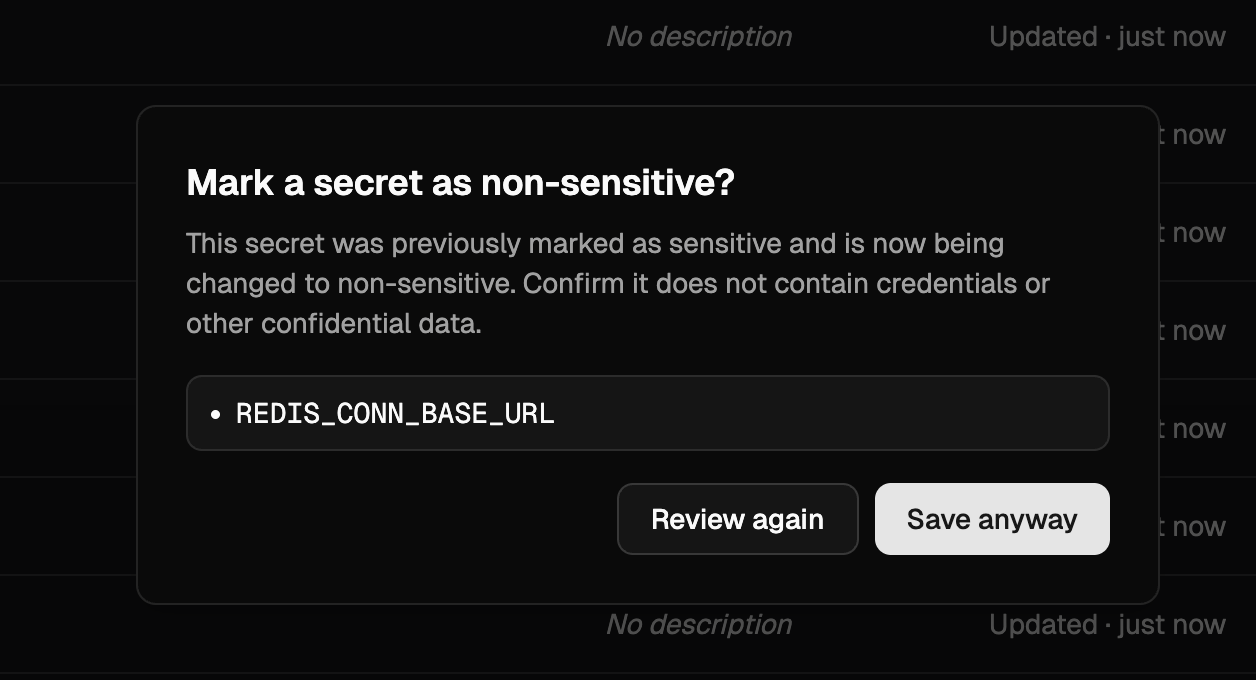
DEPLOYMENT_ID and LOPS_INSTANCE_ID built-in secrets
Every service now receives DEPLOYMENT_ID and LOPS_INSTANCE_ID as built-in environment variables. Both carry the same
24-character alphanumeric value (as unique as a UUIDv4) — unique per LocalOps-managed environment, and unique per Helm
install of charts generated by LocalOps. Use either to tag logs, metrics or external resources with the originating
environment.See Built-in secrets for the full list.Import environment
You can now create a new environment from one or more existing environments in just a few clicks via Import environment. In a brand new environment, click the 3-dots on the top right and choose “Import from environment”. Pick a source environment and import — all services, secrets and cloud resources (RDS, ElastiCache, S3, etc.) are copied over, with inter-dependencies preserved, so you can start deploying as soon as the import finishes.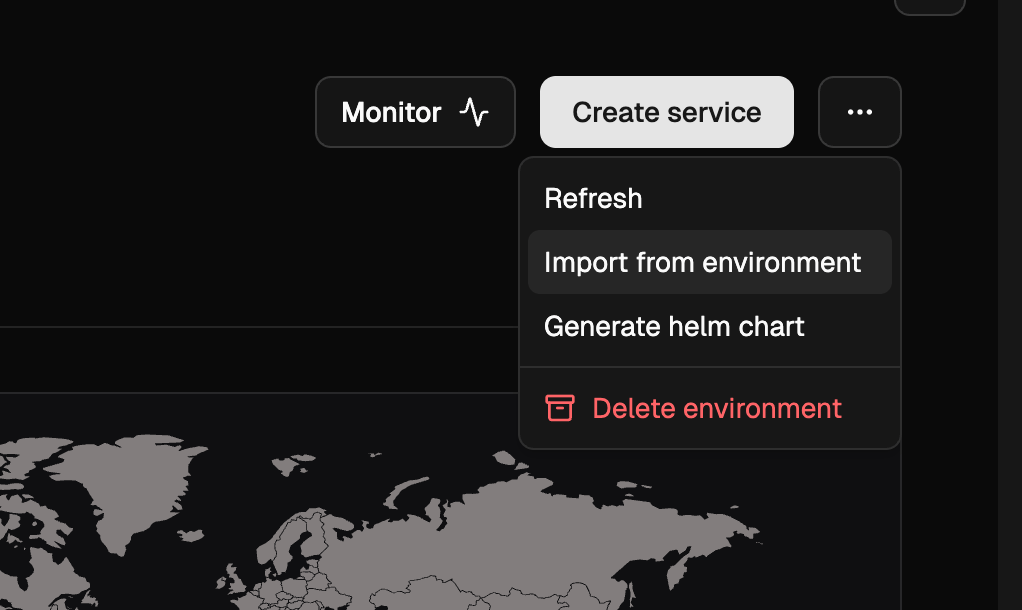
managed_password toggle for RDS
RDS instances in ops.json now accept a managed_password boolean. The default is true, where AWS RDS generates the
master password, stores it in its own AWS Secrets Manager entry, and rotates it automatically. Setting it to false
makes LocalOps generate a cryptographically unique string and use it as the RDS master password instead — the password
is then not rotated, so this mode is not recommended. Regardless of which mode you pick, use $password and $dsn in
exports to fetch the current password and connection string; LocalOps resolves them transparently in both cases.OpenSearch as a dependency
You can now declare Amazon OpenSearch domains underdependencies.opensearch.domains in ops.json. LocalOps provisions
production-tuned domains by default — 3-node multi-AZ quorum, encryption at rest, node-to-node encryption, HTTPS-only
with TLS 1.2, fine-grained access control with an auto-generated master user in AWS Secrets Manager, and audit logging
to CloudWatch. Preview environments are automatically scaled down to a single node. See
OpenSearch for the full reference.parameters for RDS and ElastiCache
Both RDS instances and ElastiCache clusters now accept a parameters list in ops.json to configure DB / cache
parameter group settings inline. LocalOps creates a dedicated parameter group for the resource and keeps it in sync as
you add, update or remove entries on subsequent deployments.For RDS, each entry takes a name, value and an apply_method of immediate or pending-reboot (use the latter for
parameters like shared_preload_libraries that need a restart):name and value:Plaintext $password and $dsn exports for RDS
RDS exports now include $password and $dsn alongside the existing $passwordArn. $password resolves the master
user password from AWS Secrets Manager and injects it directly as an environment variable, so your code does not need to
call the Secrets Manager API. $dsn is a ready-to-use connection string in the form
postgres://$username:$password@$address:5432/$dbName (or the MySQL equivalent) for libraries that accept a single URL.
Treat both values as secrets.Import managed secrets from other services
Secrets exported viaops.json now appear in each service’s console secrets section as managed secrets. You can
pull those exports into any other service in the same environment as a single secret — every key the source service
exported is injected as environment variables in the importing service.This is useful for wiring databases, caches and other declared cloud resources into the services that consume them. For
example, a boot script job can declare an RDS instance in ops.json and export its DSN, username and password; any
other service in the same environment can then import them all in one line. See
Importing other service secrets
for the syntax.Search in the service switcher
The service switcher now has a search bar at the top, so you can jump to a service by typing instead of scrolling. Handy in environments with a long list of services.Deletion protection for critical services
You can now turn on deletion protection for a service from its settings. Once enabled, the service cannot be deleted until protection is explicitly turned off — a safety net for production and other critical services where an accidental delete could cause downtime.✋ Improvements and bug fixes
We have shipped a handful of bug fixes and small enhancements today to make day-to-day operations smoother. These are the kind of polish that adds up over time. Read on for the highlights.Stop and start services on demand
Each service dashboard now has a Stop button in the top right corner. Use it to scale down a service’s replica/container count to0 on demand, without deleting the service or its configuration. Click start button to bring
it back up.Consistent image tag on redeploys
After updating secrets or scaling settings, users can trigger a new deployment. For docker image based services, this deployment was previously pulling the image with thelatest tag. It now uses the exact image tag from the previous
deployment, so redeploys stay consistent with what was last running.Valkey support for ElastiCache
ElastiCache clusters declared inops.json can now use valkey as the engine, alongside redis and memcache. Pick a
supported version from the
AWS Valkey versions list.
See ElastiCache for details.SSL passthrough
Services can now handle TLS termination themselves instead of letting the environment’s nginx ingress decrypt traffic. Setssl_passthrough to true in ops.json and configure your service’s port to 443 so the ingress forwards raw TLS
connections directly to your container. Useful for mTLS, custom certificate handling, or any protocol requiring
end-to-end TLS. See SSL passthrough for
details.Instrument services with internal /metrics endpoint
You can record custom metrics and expose them to in-built prometheus monitoring stack via/metrics endpoint. Just add
an ops.json file in your repository and declare “metrics” configuration as documented here -
Instrument services to get started.- language run time metrics - NodeJS event loop metrics, JVM metrics, etc.,
- connection and request metrics like “tcp_connections_open”
- business metrics like “number_of_payments”
- transactional metrics like “number_of_emails_sent”
Pro tip - Checkout the language specific guides to learn how you can unveil advanced metrics & dashaboards in just few
mins of setup (eg: See this Java guide)
Request timeouts
Set timeouts for TCP connections or requests handled by your services. Default timeout 60s may not be suitable for realtime applications with long running connections. Start declaring custom timeout values in ops.json as specificed in developer docs - Request timeouts.Private IPs passed as environment vars
POD_IP and HOST_IP are now injected in each service as environment variables. So if your application requires its
own IP address, you can fetch and utilize in your business logic.Learn more about built-in environment vars
like these.Other UI enhancements and fixes
- Saving secrets triggers a “Write secrets” op to keep track of secret updates
- While creating new service, search for repositories using the new search bar in the repository picker
- Bug fixes in Member invite workflow
- Bug fixes in preview environments
- Other fixes in slack and ms teams notificaitons
Projects revampled
We have revamped Projects. You can now create projects and organize environments in them.Members
Projects can have members. Unless an org member is also added as a project member, they can’t see the project’s environments or deploy to them.Revampled navigation bar
Sidebar navigation menu is revamped to make it easy to switcher between organization and projects.Other bug fixes and UI enhancements were made too.Organization SSO (SAML 2.0)
We’ve introduced Single Sign-On (SSO) via SAML 2.0, allowing teams to manage access through their preferred identity providers. This feature simplifies user onboarding and enhances security by centralizing authentication.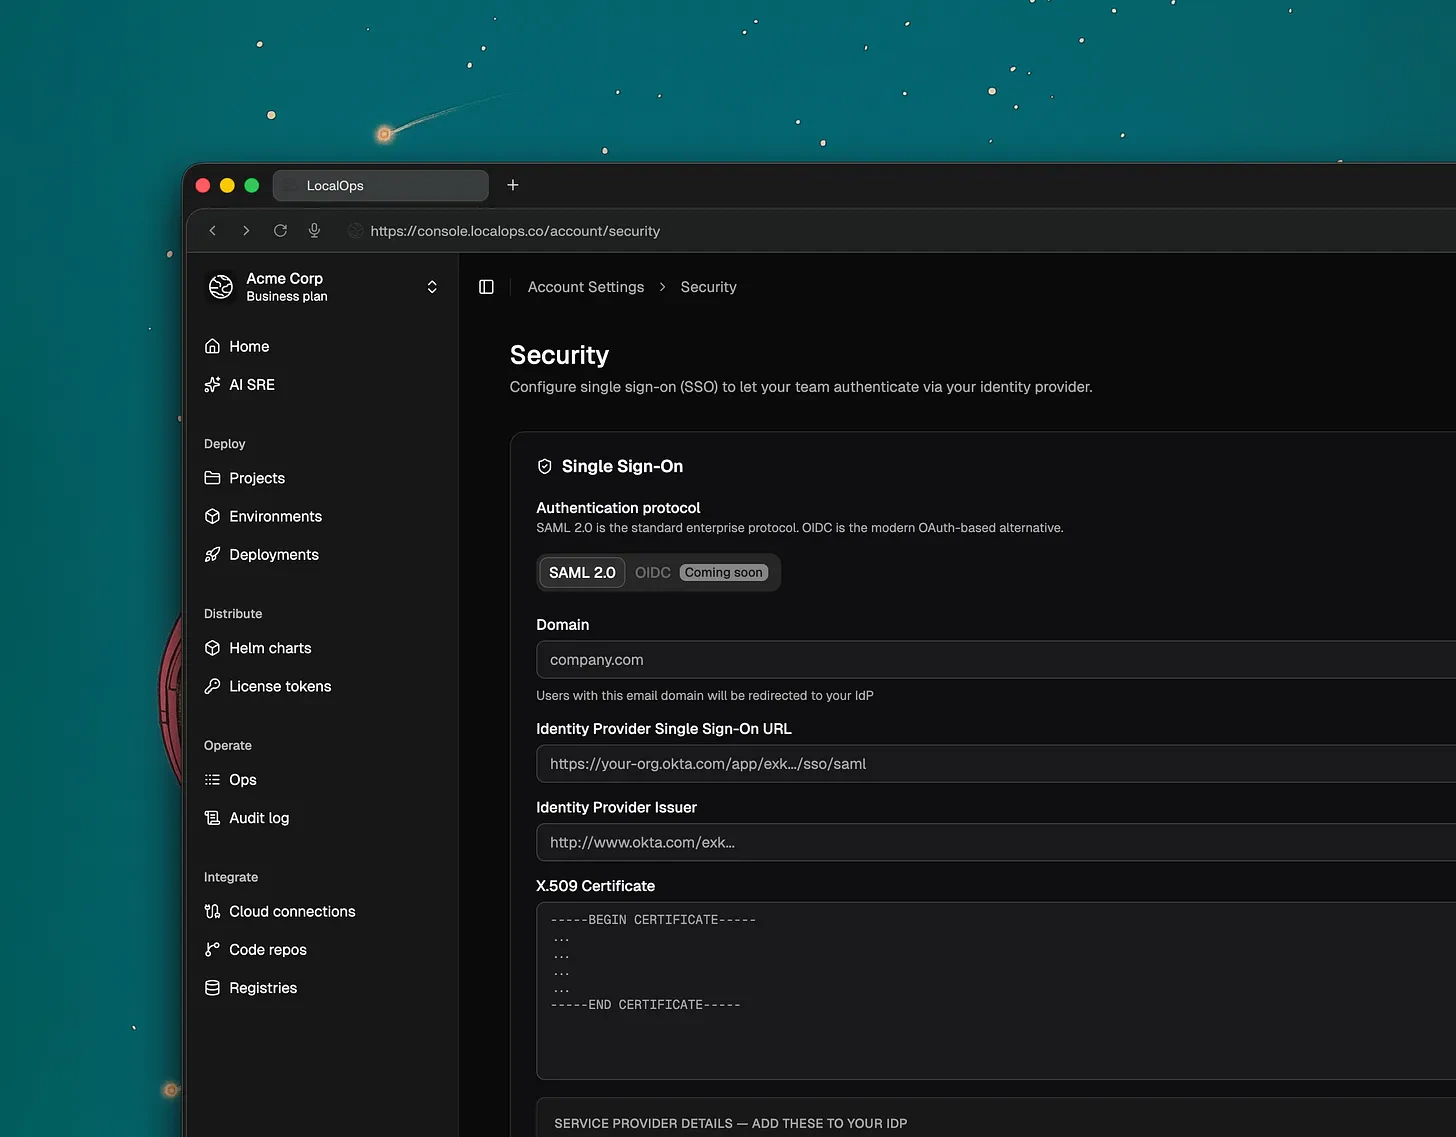
- Okta
- Microsoft Entra ID
- Google Workspace SSO
- OneLogin
- Auth0
What’s Next: OIDC (OpenID Connect) support is currently in development and will be released soon.
Improved CLI Organization Management
Users who belong to multiple organizations can now explicitly select their active organization directly within the Command Line Interface (CLI). This ensures that commands and deployments are always targeted at the correct environment without manual configuration overrides.Simplified Manual Deployments
To streamline the redeployment process, we’ve added a new option in the manual deployment section. You can now quickly select and use the last successfully deployed Docker or Helm images, reducing the risk of version mismatch during quick fixes or rollbacks.Security Improvements
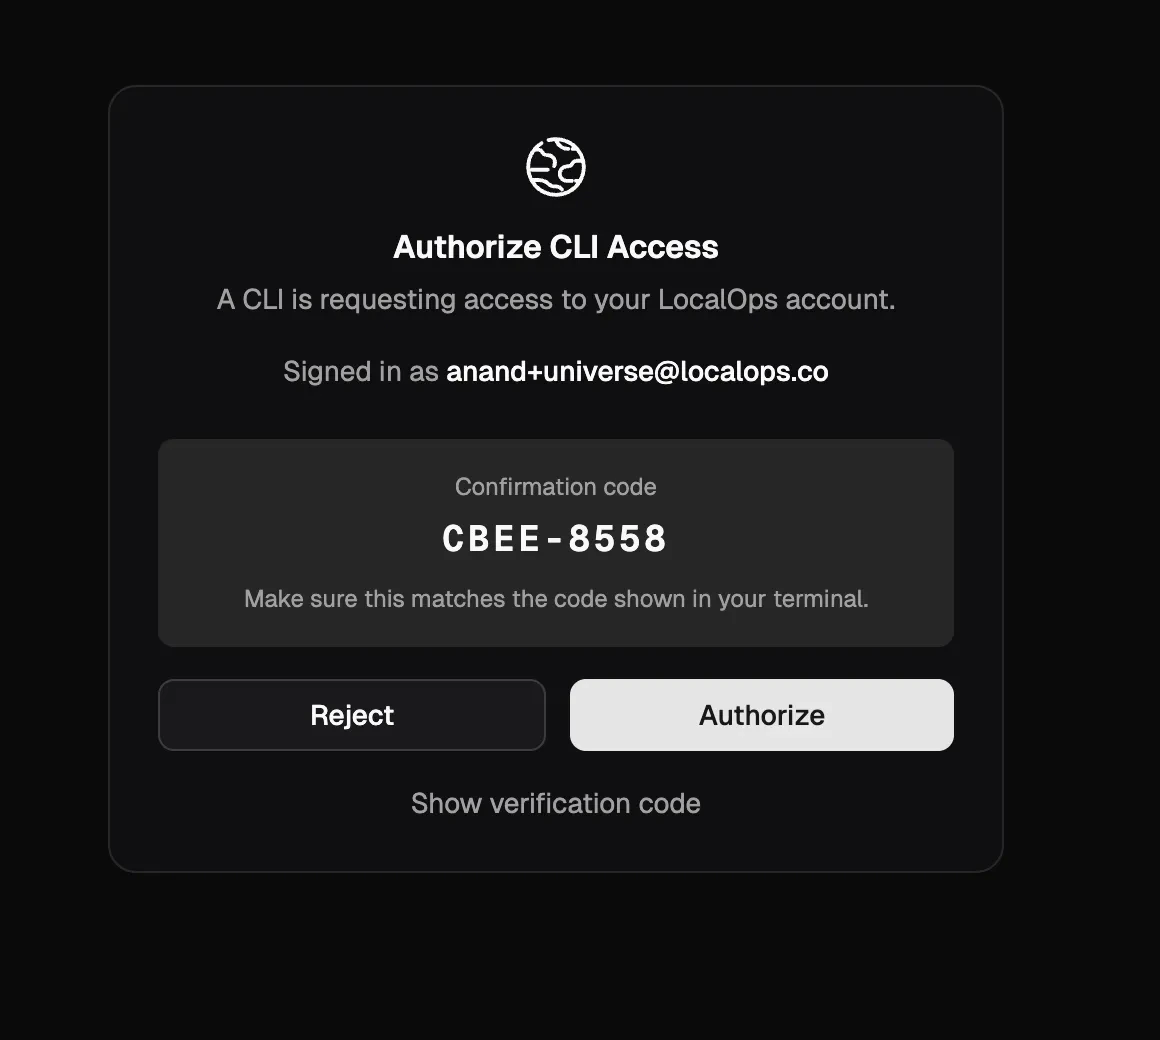
We’ve strengthened the security of our OAuth device authorization flow to further using stricter state validation and session integrity.Switch organizations/teams & New CLI update
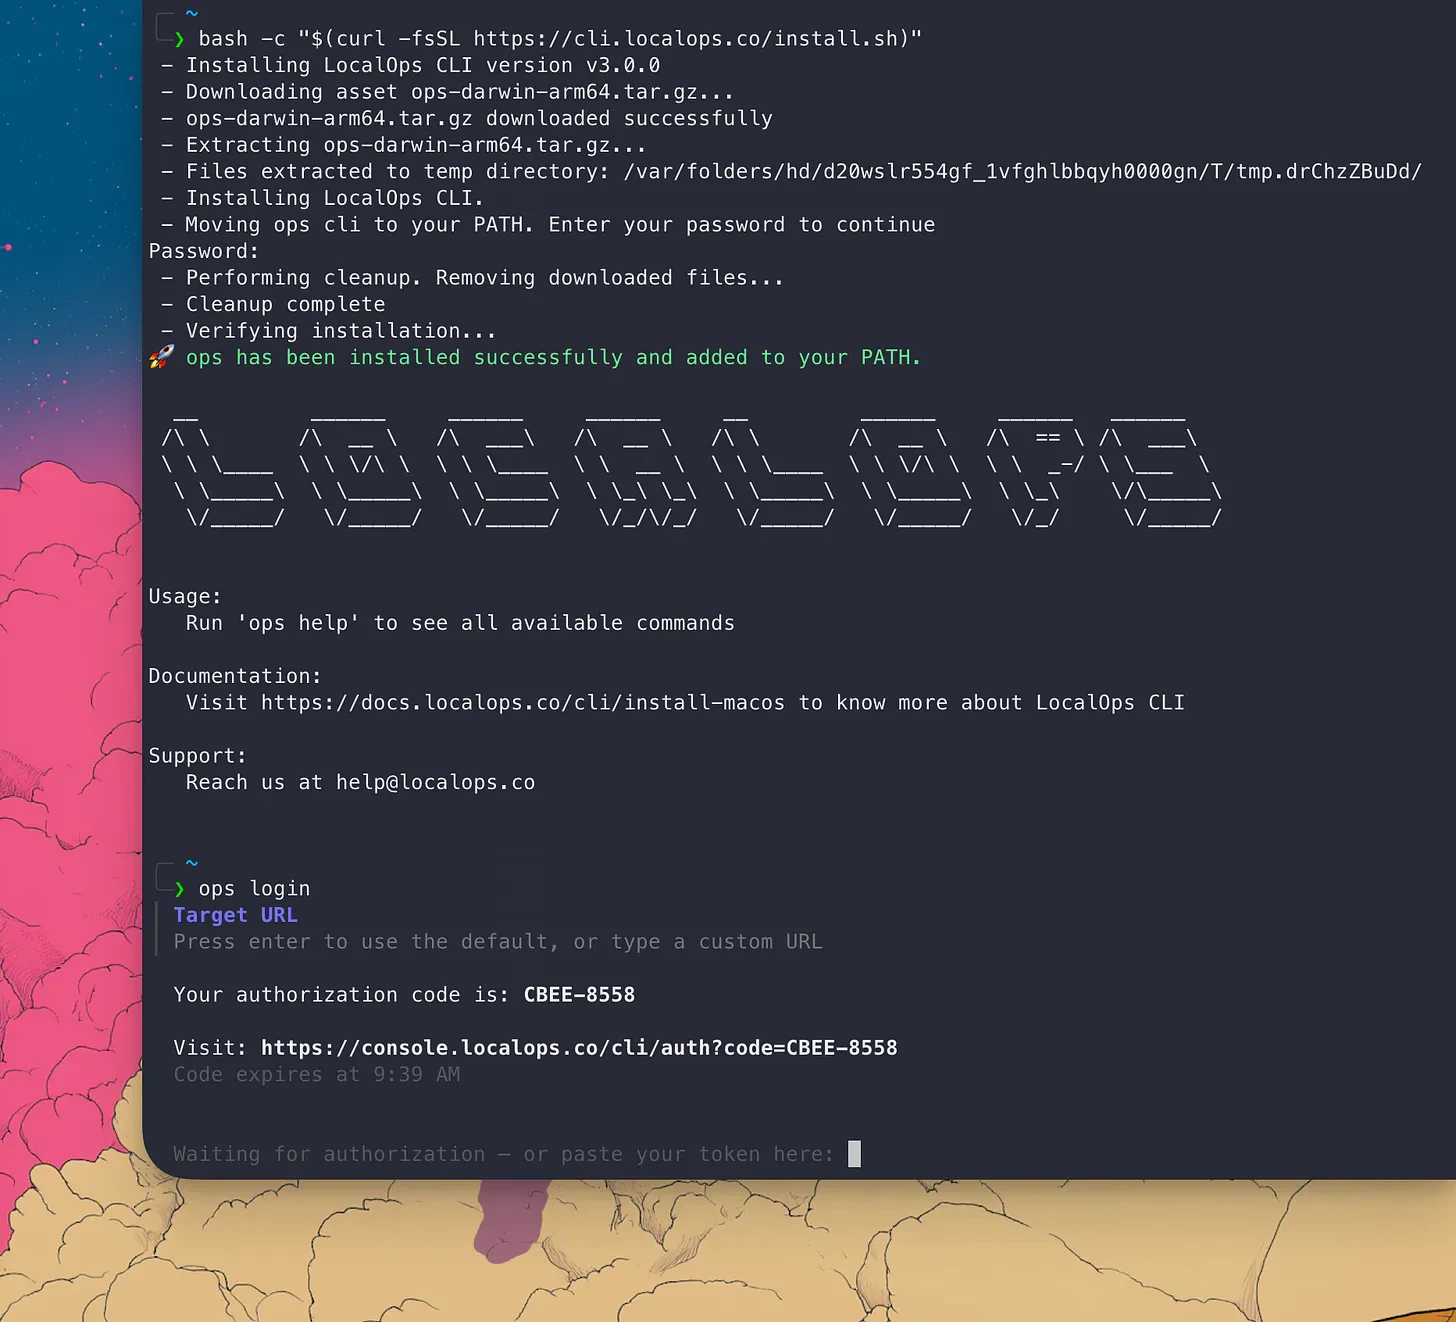
If you run multiple products and multiple engineering teams handling their own qa, uat and production environments, you will love this update.Switch organizations:Users can now belong to multiple organizations using their same login / email address. And they can easily switch between the organizations from the top left menu like this: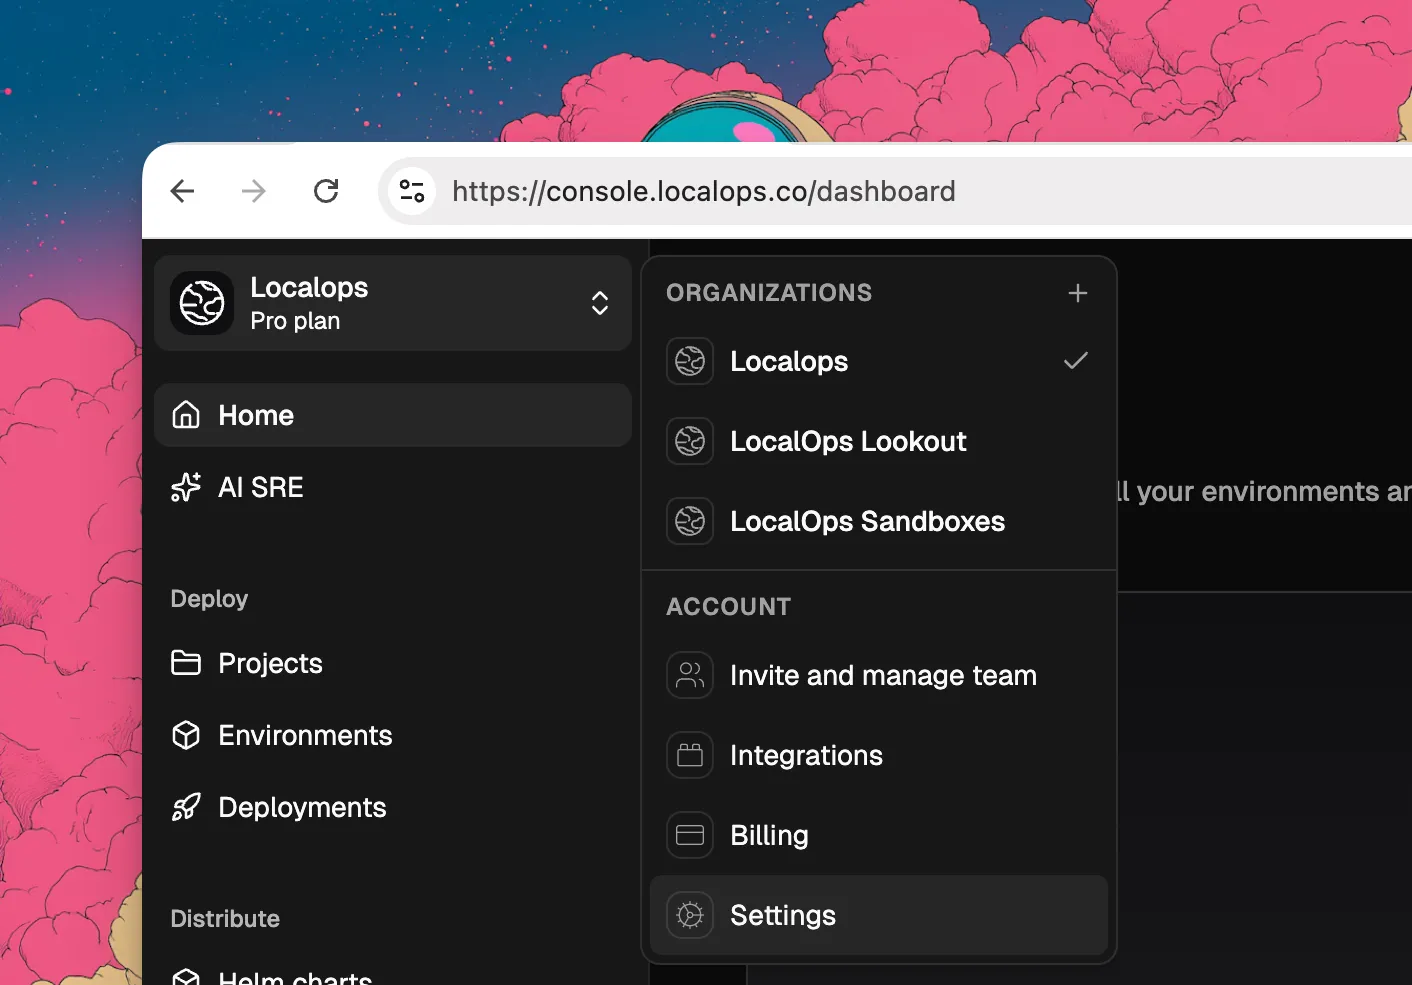
- Github org
- ECR Registries
- Environments
- qa
- uat
- production
- Deployments
Custom CIDRs for environments
While creating new environments, you can now specify custom CIDR block for your environments. This will be used to create VPCs and subnets in your cloud accounts and will give more control over your network configurations.In the Create environment page, you can click on “Advanced options” to see the new field for custom CIDR block. You can specify any valid CIDR block that you want for your environment.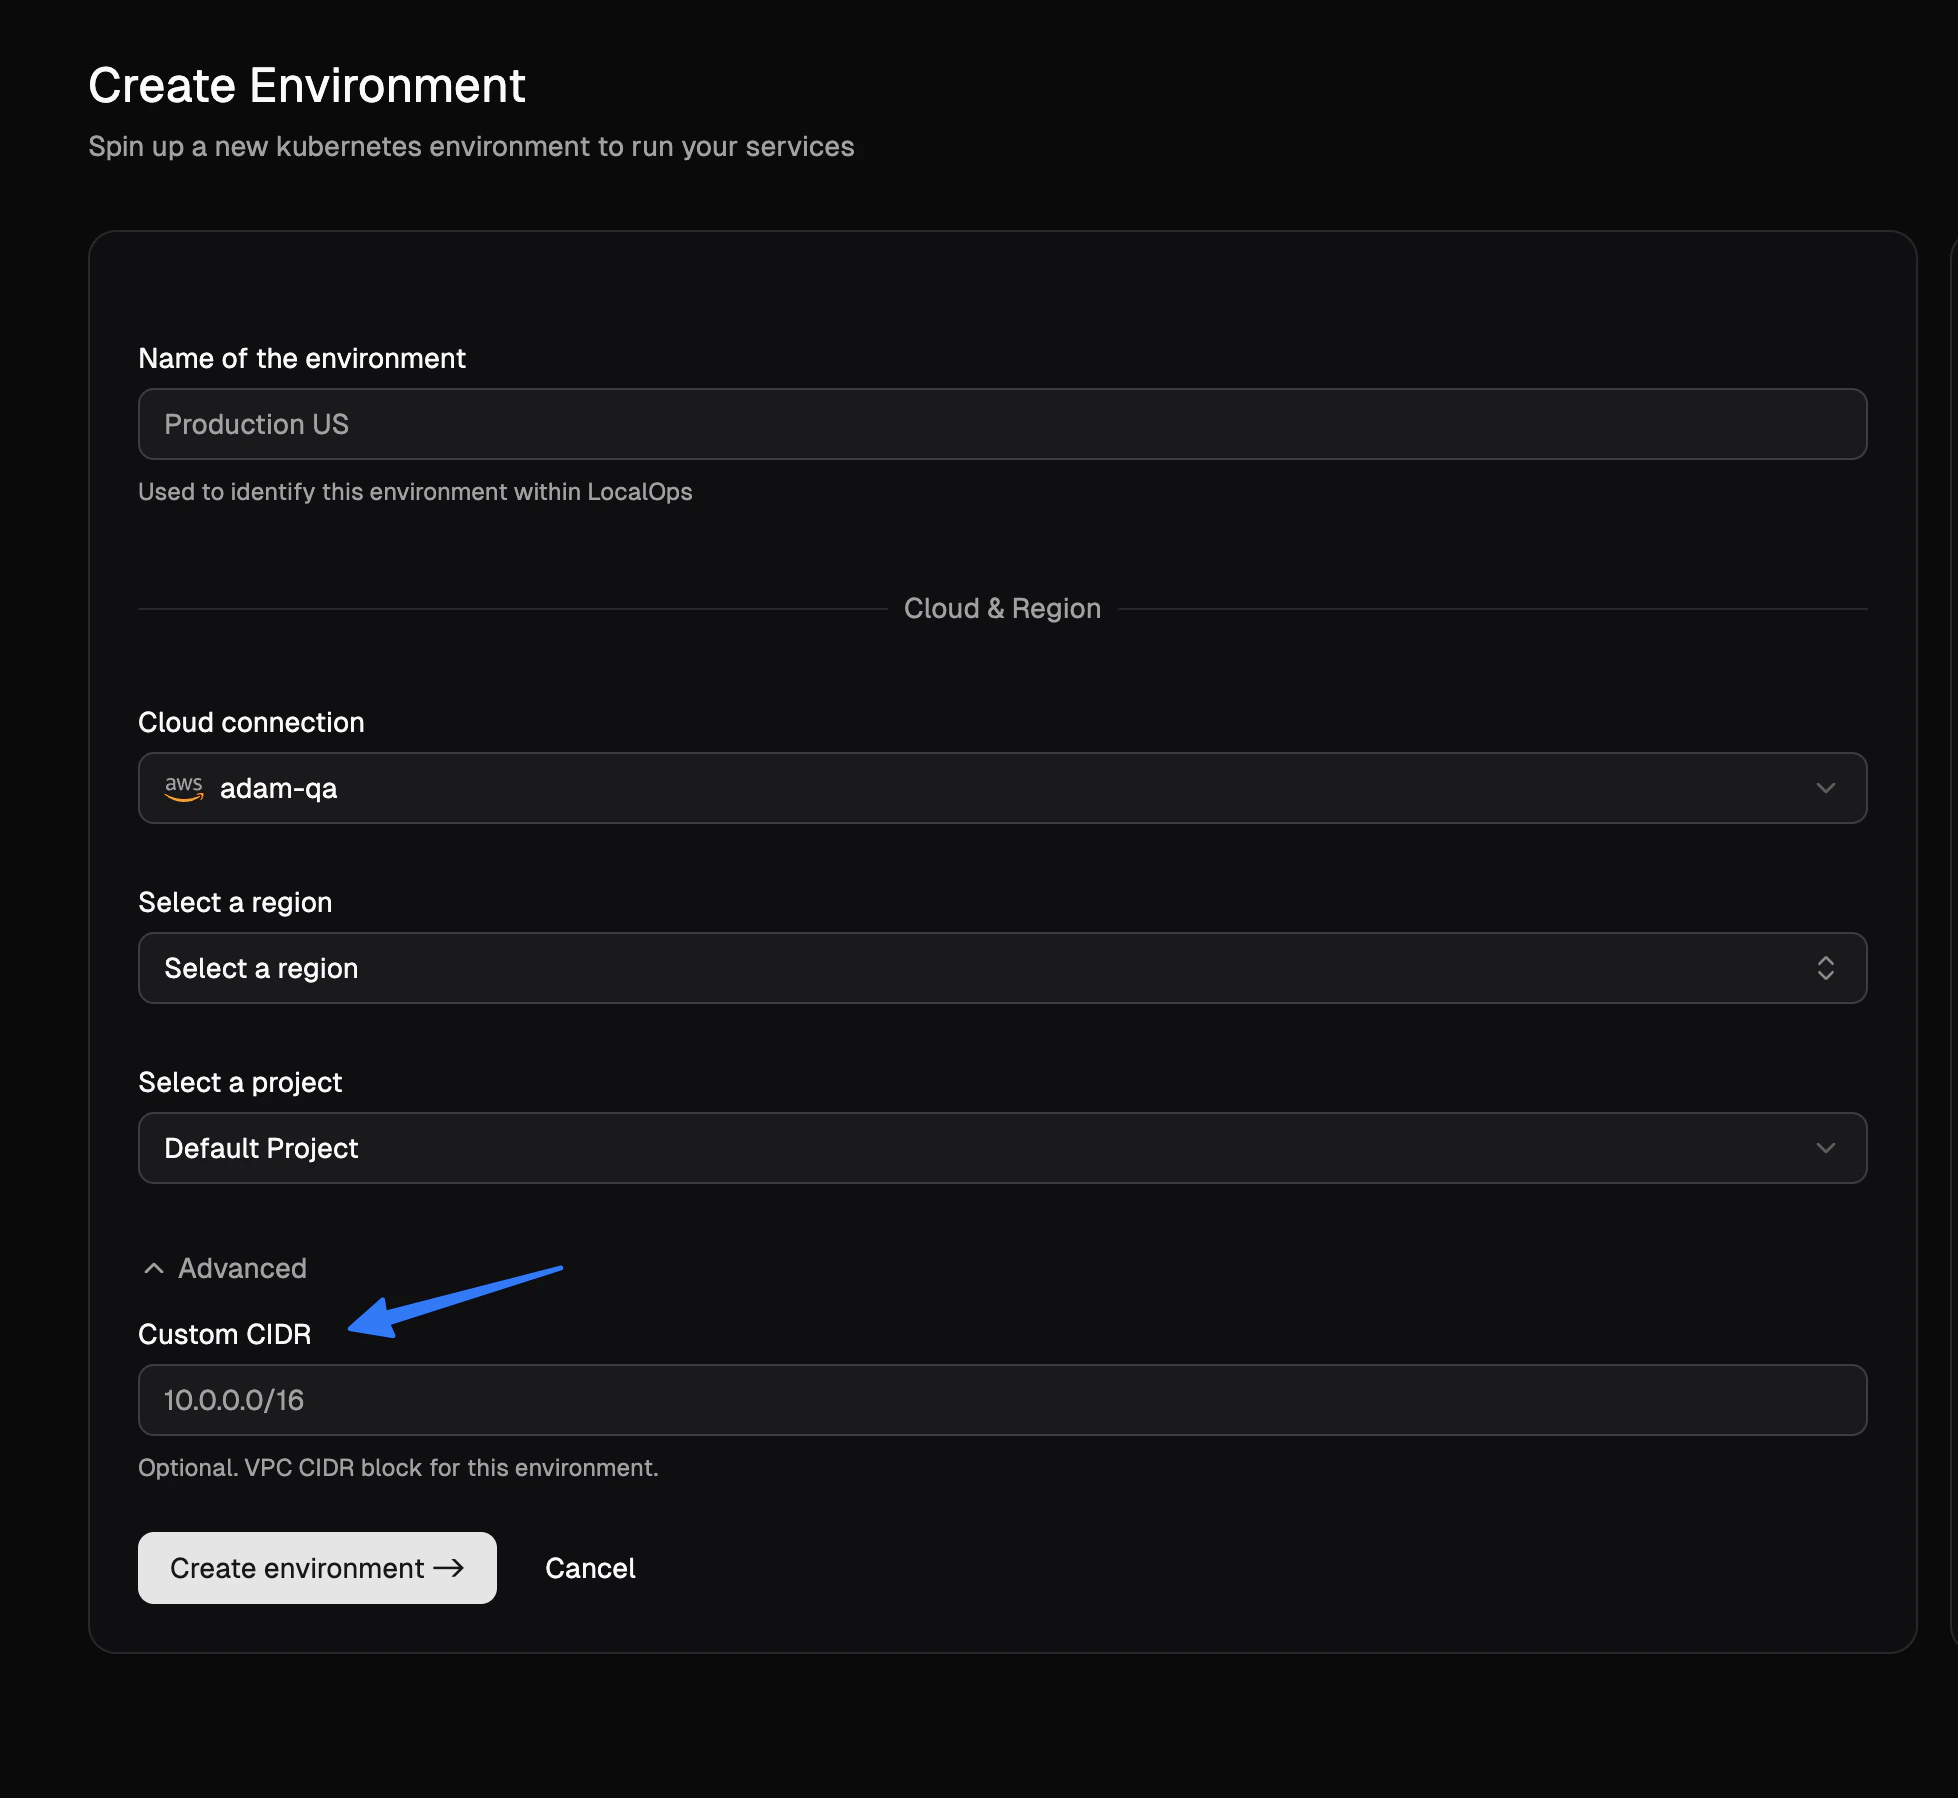
Realtime run status of services
We released a major new enhancement to services today. You can now see the realtime status of all services running within each environment, without having to use LocalOps CLI or Kubectl CLI.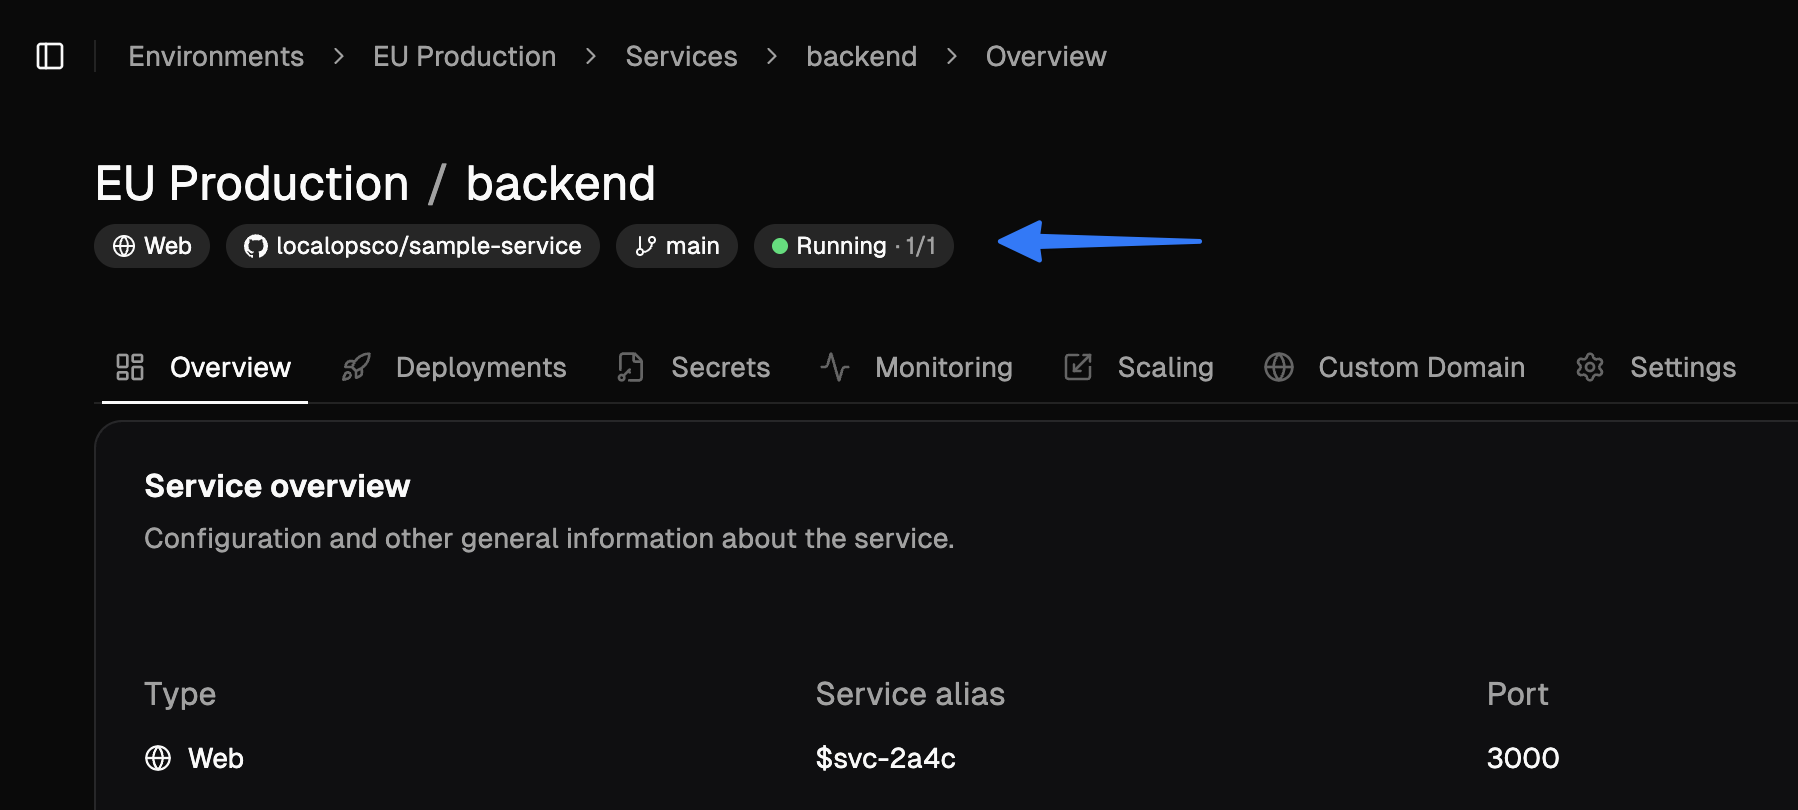
web, internal services and worker services, you will see the following statuses:- running (2/2)
- degraded (1/2)
- failing (0/2)
- stopped
- pending
- succeeded
- failed
- timeout
- idle
- active
- suspended
New “Runs” tab
Lookout for the new “Runs” tab for job and cronjob services. You can see the run history and status of each run.We update statuses in near real time so you would know when you service is failing, just by looking at the status text in LocalOps console.All of these changes were made to make it easier for you to monitor and manage your services, without having to drop into shell or CLI.New feature: Custom Node groups
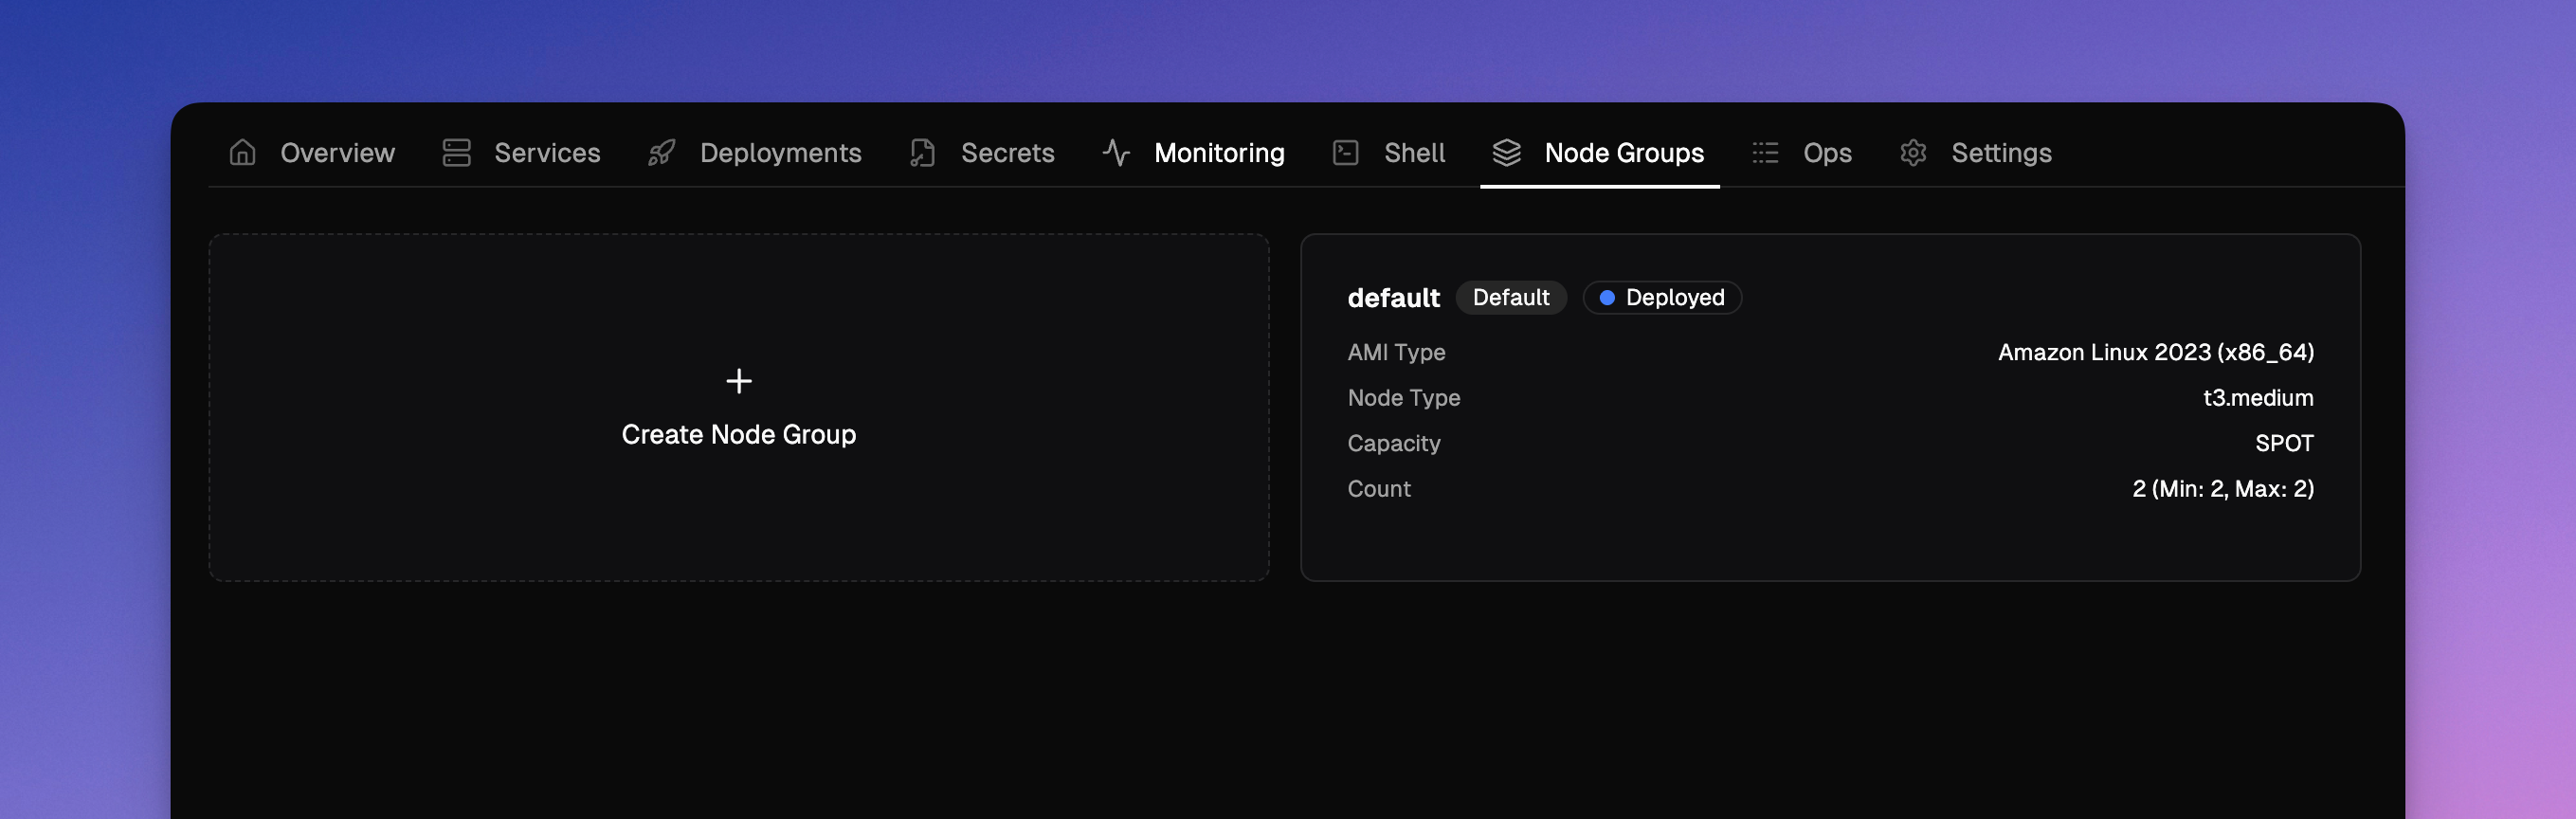
So far, environments have been having a single node group created, to run all the services.Now, you can create multiple node groups to run different types of services. For each node group you can pick- AMIs
- Instance types
- Desired count of nodes
- Windows node groups to run windows based services (or)
- Linux node groups to run linux base services
Spot instances
In the case of AWS evnironments, while creating node groups, you can pick between ON_DEMAND or SPOT as capacity types.So you can create node groups of SPOT instance type and assign interruptible and idempotent services like jobs, crons, batch processing, or other. This will end up giving up to 50% savings in compute costs.New feature: Deployment notes
While triggering new deployments, you can now pass a note text to it. And it will communicate to rest of the team about what the deployment is all about.We made other QoS updates here to ensure smooth execution of deployment pipelines.New feature: Account level resource tags
All cloud resources of all environments spinned by LocalOps are attached with two standard tags. One with ID of the environment and another with name of the environment. These tags can be used in Cost explorer to analyse costs at a granular level.We released a new feature today to accept custom tags so that you can assign your own key value pairs as tags for all resources spinned up in all environments of the account. You can use it to attach tags like:bu: internalbu: product-1project: project-name
Bring your own registry
LocalOps can now use your images from your own docker registry to deploy services in your environments. Go to the new Registries section to add any private docker registry.We support ECR & DockerHub as of today and plan to support other providers in the coming weeks.- Amazon Elastic Container Registry (ECR)
- DockerHub
- Google container registry
- Azure container registry
- Github packages
Bring your code pipeline
Deploy using LocalOps API
You can run your exisitng code build pipelines to build code and finally call LocalOps API to deploy the code to your environment. Checkout the API reference for the new /deploy api here.Eg.,🍦 Deploy using LocalOps Github action
To cut work, you can also embed our Github action step directly within your.github/workflows/deploy.yml to trigger
new deployments.Like:docker_image_tag or commit_id or helm_chart_version to the action to trigger new deployments.or with commit sha like: